75) Draw a scatter diagram s for the different values a correlation Co-eficient r' qiuen below! below: Wr=-1()r=o liv)r=0-90 lu)r=0-10 0 Explain the t'and 'y' in each of the aboue case type of relationship you coould expect beneen ype
75) Draw a scatter diagram s for the different values a correlation Co-eficient r' qiuen below! below: Wr=-1()r=o liv)r=0-90 lu)r=0-10 0 Explain the t'and 'y' in each of the aboue case type of relationship you coould expect beneen ype

MATLAB: An Introduction with Applications
6th Edition
ISBN:9781119256830
Author:Amos Gilat
Publisher:Amos Gilat
Chapter1: Starting With Matlab
Section: Chapter Questions
Problem 1P

Related questions
Question

Transcribed Image Text:75) Draw a scatter diagram s for the different values a
correlation Co-eficient r' qiuen below!
below:
Wr=-1()r=o liv)r=0-90 lu)r=0-10 0
Explain the
t'and 'y' in each of the aboue case
type of relationship you coould expect beneen
ype
Expert Solution
Step 1
Hello. Since your question has multiple sub-parts, we will solve first three sub-parts for you. If you want remaining sub-parts to be solved, then please resubmit the whole question and specify those sub-parts you want us to solve.
i)
The scatter diagram can be plotted for r = 1 as follow:
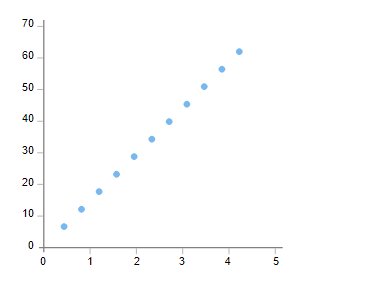
There is strong positive relationship between the variables x and y. If the value of x increases the value of y will also increases, similarly if the value of x decreases the value of y will also decreases.
Step 2
ii)
The scatter diagram for r = -1 can be plotted as follow:
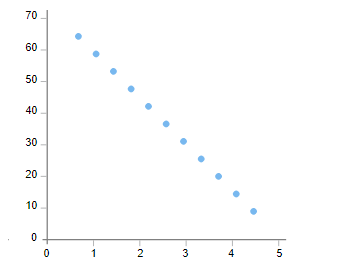
There is strong negative relationship between the variables x and y. If the value of x increases the value of y decreases.

Step by step
Solved in 3 steps with 3 images

Knowledge Booster


Learn more about
Need a deep-dive on the concept behind this application? Look no further. Learn more about this topic, statistics and related others by exploring similar questions and additional content below.Recommended textbooks for you
MATLAB: An Introduction with Applications
Statistics
ISBN:
9781119256830
Author:
Amos Gilat
Publisher:
John Wiley & Sons Inc

Probability and Statistics for Engineering and th…
Statistics
ISBN:
9781305251809
Author:
Jay L. Devore
Publisher:
Cengage Learning

Statistics for The Behavioral Sciences (MindTap C…
Statistics
ISBN:
9781305504912
Author:
Frederick J Gravetter, Larry B. Wallnau
Publisher:
Cengage Learning
MATLAB: An Introduction with Applications
Statistics
ISBN:
9781119256830
Author:
Amos Gilat
Publisher:
John Wiley & Sons Inc
Probability and Statistics for Engineering and th…
Statistics
ISBN:
9781305251809
Author:
Jay L. Devore
Publisher:
Cengage Learning
Statistics for The Behavioral Sciences (MindTap C…
Statistics
ISBN:
9781305504912
Author:
Frederick J Gravetter, Larry B. Wallnau
Publisher:
Cengage Learning

Elementary Statistics: Picturing the World (7th E…
Statistics
ISBN:
9780134683416
Author:
Ron Larson, Betsy Farber
Publisher:
PEARSON

The Basic Practice of Statistics
Statistics
ISBN:
9781319042578
Author:
David S. Moore, William I. Notz, Michael A. Fligner
Publisher:
W. H. Freeman

Introduction to the Practice of Statistics
Statistics
ISBN:
9781319013387
Author:
David S. Moore, George P. McCabe, Bruce A. Craig
Publisher:
W. H. Freeman