7:07 PM Tue Oct 3 MY NOTES ASK YOUR TEACHER Consultant A Consultant B 71 = x₁ = 6.81 $₁ = 0.64 <=16 You may need to use the appropriate technology to answer this question. Periodically, customers of a financial services company are asked to evaluate the company's financial consultants and services. Higher ratings on the client satisfaction survey indicate better service, with 7 the maximum service rating. Independent samples of service ratings for two financial consultants are summarized here. Consultant A has 10 years of experience, whereas consultant B has 1 year of experience. Use a = 0.05 and test to see whether the consultant with more experience has the higher population mean service rating. webassign.net PRACTICE ANOTHER 7₂ = 10 x₂ = 6.28 $2 = 0.75 ... (a) State the null and alternative hypotheses. o Hoi thi thy 50 Hồ thì không 30 0 H : H1 - H2 + 0 H₁₂ : H₁ - H₂ = 0 OHO: H₁-H₂SO H₂H₁-H₂=0 o Hoi thi - ty>0 H₂H₁-H₂SO o Hoi thi không =0 Hỏi khi thay #0 (b) Compute the value of the test statistic. (Round your answer to three decimal places.) 1.852 X You may have rounded in the wrong direction. @19% 1 (c) What is the p-value? (Round your answer to four decimal places.)
7:07 PM Tue Oct 3 MY NOTES ASK YOUR TEACHER Consultant A Consultant B 71 = x₁ = 6.81 $₁ = 0.64 <=16 You may need to use the appropriate technology to answer this question. Periodically, customers of a financial services company are asked to evaluate the company's financial consultants and services. Higher ratings on the client satisfaction survey indicate better service, with 7 the maximum service rating. Independent samples of service ratings for two financial consultants are summarized here. Consultant A has 10 years of experience, whereas consultant B has 1 year of experience. Use a = 0.05 and test to see whether the consultant with more experience has the higher population mean service rating. webassign.net PRACTICE ANOTHER 7₂ = 10 x₂ = 6.28 $2 = 0.75 ... (a) State the null and alternative hypotheses. o Hoi thi thy 50 Hồ thì không 30 0 H : H1 - H2 + 0 H₁₂ : H₁ - H₂ = 0 OHO: H₁-H₂SO H₂H₁-H₂=0 o Hoi thi - ty>0 H₂H₁-H₂SO o Hoi thi không =0 Hỏi khi thay #0 (b) Compute the value of the test statistic. (Round your answer to three decimal places.) 1.852 X You may have rounded in the wrong direction. @19% 1 (c) What is the p-value? (Round your answer to four decimal places.)
MATLAB: An Introduction with Applications
6th Edition
ISBN:9781119256830
Author:Amos Gilat
Publisher:Amos Gilat
Chapter1: Starting With Matlab
Section: Chapter Questions
Problem 1P
Related questions
Question

Transcribed Image Text:**Evaluating Financial Consultants Using Statistical Analysis**
**Introduction:**
Financial services companies periodically assess their consultants using client satisfaction surveys. Higher ratings suggest better service, with 7 being the maximum score. In this study, we compare two financial consultants: Consultant A (10 years of experience) and Consultant B (1 year of experience). The aim is to determine if the more experienced consultant has a higher mean service rating using a significance level of \( \alpha = 0.05 \).
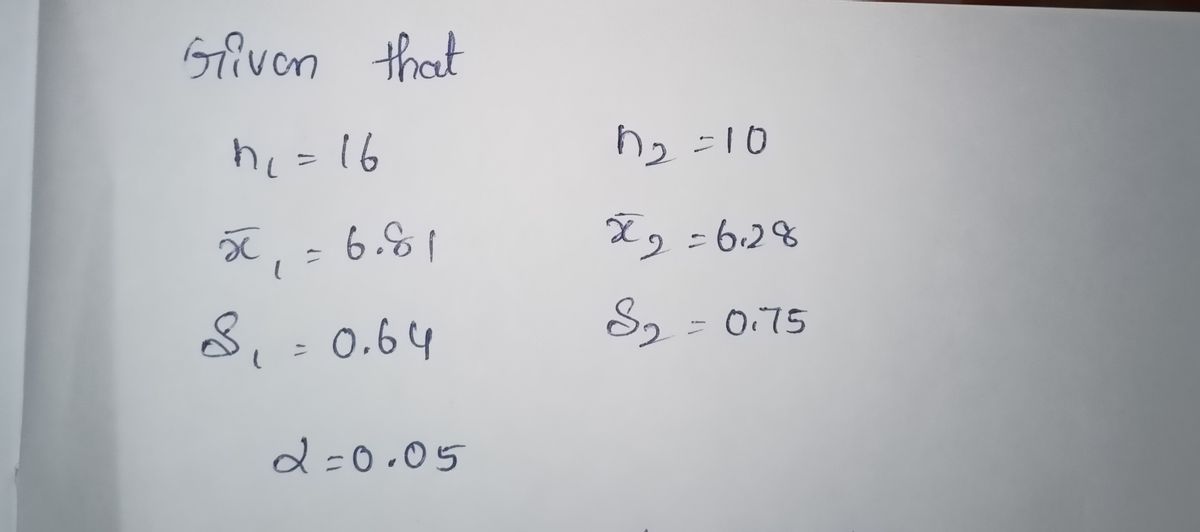
**Data Summary:**
- **Consultant A:**
- Sample Size (\( n_1 \)): 16
- Mean (\( \bar{x}_1 \)): 6.81
- Standard Deviation (\( s_1 \)): 0.64
- **Consultant B:**
- Sample Size (\( n_2 \)): 10
- Mean (\( \bar{x}_2 \)): 6.28
- Standard Deviation (\( s_2 \)): 0.75
**Hypotheses:**
a) **Null and Alternative Hypotheses:**
- \( H_0: \mu_1 - \mu_2 \leq 0 \)
- \( H_a: \mu_1 - \mu_2 > 0 \)
**Statistical Analysis:**
b) **Test Statistic:**
- Incorrect answer provided: 1.852
- Note: "You may have rounded in the wrong direction."
c) **p-value:**
- Incorrect p-value provided: 0.9587
- Note: "You may have found the complement of the desired probability."
**Conclusion:**
d) **Final Decision:**
- Do not reject \( H_0 \): There is sufficient evidence to conclude that the consultant with more experience has a higher population mean rating.
**Note for Students:**
This exercise emphasizes the importance of hypothesis testing in evaluating professional competencies. Accurate calculation of test statistics and p-values is critical in making informed decisions based on client satisfaction data.
Expert Solution
Step 1: Given

Step by step
Solved in 3 steps with 2 images

Recommended textbooks for you

MATLAB: An Introduction with Applications
Statistics
ISBN:
9781119256830
Author:
Amos Gilat
Publisher:
John Wiley & Sons Inc

Probability and Statistics for Engineering and th…
Statistics
ISBN:
9781305251809
Author:
Jay L. Devore
Publisher:
Cengage Learning

Statistics for The Behavioral Sciences (MindTap C…
Statistics
ISBN:
9781305504912
Author:
Frederick J Gravetter, Larry B. Wallnau
Publisher:
Cengage Learning

MATLAB: An Introduction with Applications
Statistics
ISBN:
9781119256830
Author:
Amos Gilat
Publisher:
John Wiley & Sons Inc

Probability and Statistics for Engineering and th…
Statistics
ISBN:
9781305251809
Author:
Jay L. Devore
Publisher:
Cengage Learning

Statistics for The Behavioral Sciences (MindTap C…
Statistics
ISBN:
9781305504912
Author:
Frederick J Gravetter, Larry B. Wallnau
Publisher:
Cengage Learning

Elementary Statistics: Picturing the World (7th E…
Statistics
ISBN:
9780134683416
Author:
Ron Larson, Betsy Farber
Publisher:
PEARSON

The Basic Practice of Statistics
Statistics
ISBN:
9781319042578
Author:
David S. Moore, William I. Notz, Michael A. Fligner
Publisher:
W. H. Freeman

Introduction to the Practice of Statistics
Statistics
ISBN:
9781319013387
Author:
David S. Moore, George P. McCabe, Bruce A. Craig
Publisher:
W. H. Freeman