6. The Steward Institute for Environmental Studies has collected data on concentrations of carbon dioxide (CO₂) in the atmosphere since the year 1975. a. A statistical software calculates r=0.7545. Classify the correlation. Year 1975 1976 1977 1978 1979 1980 1981 1982 1983 1984 1985 1986 1987 1988 1989 1990 1991 1992 1993 1994 1995 CO₂ Level (ppm) 331 332 333.7 335.3 336.7 338.5 339.8 341 342.6 344.3 345.7 347 348.8 351.4 352.7 354 355.5 356.2 357 358.8 360.7 b. The regression equation that relates CO2 levels and the number of years since 1975 is: y = 1.5x+331 Use the regression equation to predict the level of CO₂ that you would expect to find today. c. Use the regression equation to predict the year when the level of atmospheric CO₂ is expected to reach 410 ppm.
6. The Steward Institute for Environmental Studies has collected data on concentrations of carbon dioxide (CO₂) in the atmosphere since the year 1975. a. A statistical software calculates r=0.7545. Classify the correlation. Year 1975 1976 1977 1978 1979 1980 1981 1982 1983 1984 1985 1986 1987 1988 1989 1990 1991 1992 1993 1994 1995 CO₂ Level (ppm) 331 332 333.7 335.3 336.7 338.5 339.8 341 342.6 344.3 345.7 347 348.8 351.4 352.7 354 355.5 356.2 357 358.8 360.7 b. The regression equation that relates CO2 levels and the number of years since 1975 is: y = 1.5x+331 Use the regression equation to predict the level of CO₂ that you would expect to find today. c. Use the regression equation to predict the year when the level of atmospheric CO₂ is expected to reach 410 ppm.

MATLAB: An Introduction with Applications
6th Edition
ISBN:9781119256830
Author:Amos Gilat
Publisher:Amos Gilat
Chapter1: Starting With Matlab
Section: Chapter Questions
Problem 1P

Related questions
Question

Transcribed Image Text:6. The Steward Institute for Environmental Studies has collected data on concentrations of carbon dioxide (CO₂)
in the atmosphere since the year 1975.
Year
1975
1976
1977
1978
1979
1980
1981
1982
1983
1984
1985
1986
1987
1988
1989
1990
1991
1992
1993
1994
1995
CO₂ Level a. A statistical software calculates r=0.7545. Classify the correlation.
(ppm)
331
332
333.7
335.3
336.7
338.5
339.8
341
342.6
344.3
345.7
347
348.8
351.4
352.7
354
355.5
356.2
357
358.8
360.7
b. The regression equation that relates CO2 levels and the number of years since 1975
is: y = 1.5x+331 Use the regression equation to predict the level of CO₂ that you would
expect to find today.
c. Use the regression equation to predict the year when the level of atmospheric CO₂ is
expected to reach 410 ppm.
Expert Solution
Step 1
Given data of year and atmospheric CO2 level as shown below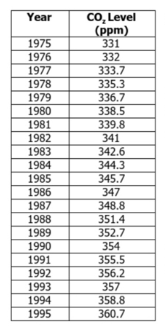

Step by step
Solved in 2 steps with 1 images

Recommended textbooks for you
MATLAB: An Introduction with Applications
Statistics
ISBN:
9781119256830
Author:
Amos Gilat
Publisher:
John Wiley & Sons Inc

Probability and Statistics for Engineering and th…
Statistics
ISBN:
9781305251809
Author:
Jay L. Devore
Publisher:
Cengage Learning

Statistics for The Behavioral Sciences (MindTap C…
Statistics
ISBN:
9781305504912
Author:
Frederick J Gravetter, Larry B. Wallnau
Publisher:
Cengage Learning
MATLAB: An Introduction with Applications
Statistics
ISBN:
9781119256830
Author:
Amos Gilat
Publisher:
John Wiley & Sons Inc
Probability and Statistics for Engineering and th…
Statistics
ISBN:
9781305251809
Author:
Jay L. Devore
Publisher:
Cengage Learning
Statistics for The Behavioral Sciences (MindTap C…
Statistics
ISBN:
9781305504912
Author:
Frederick J Gravetter, Larry B. Wallnau
Publisher:
Cengage Learning

Elementary Statistics: Picturing the World (7th E…
Statistics
ISBN:
9780134683416
Author:
Ron Larson, Betsy Farber
Publisher:
PEARSON

The Basic Practice of Statistics
Statistics
ISBN:
9781319042578
Author:
David S. Moore, William I. Notz, Michael A. Fligner
Publisher:
W. H. Freeman

Introduction to the Practice of Statistics
Statistics
ISBN:
9781319013387
Author:
David S. Moore, George P. McCabe, Bruce A. Craig
Publisher:
W. H. Freeman