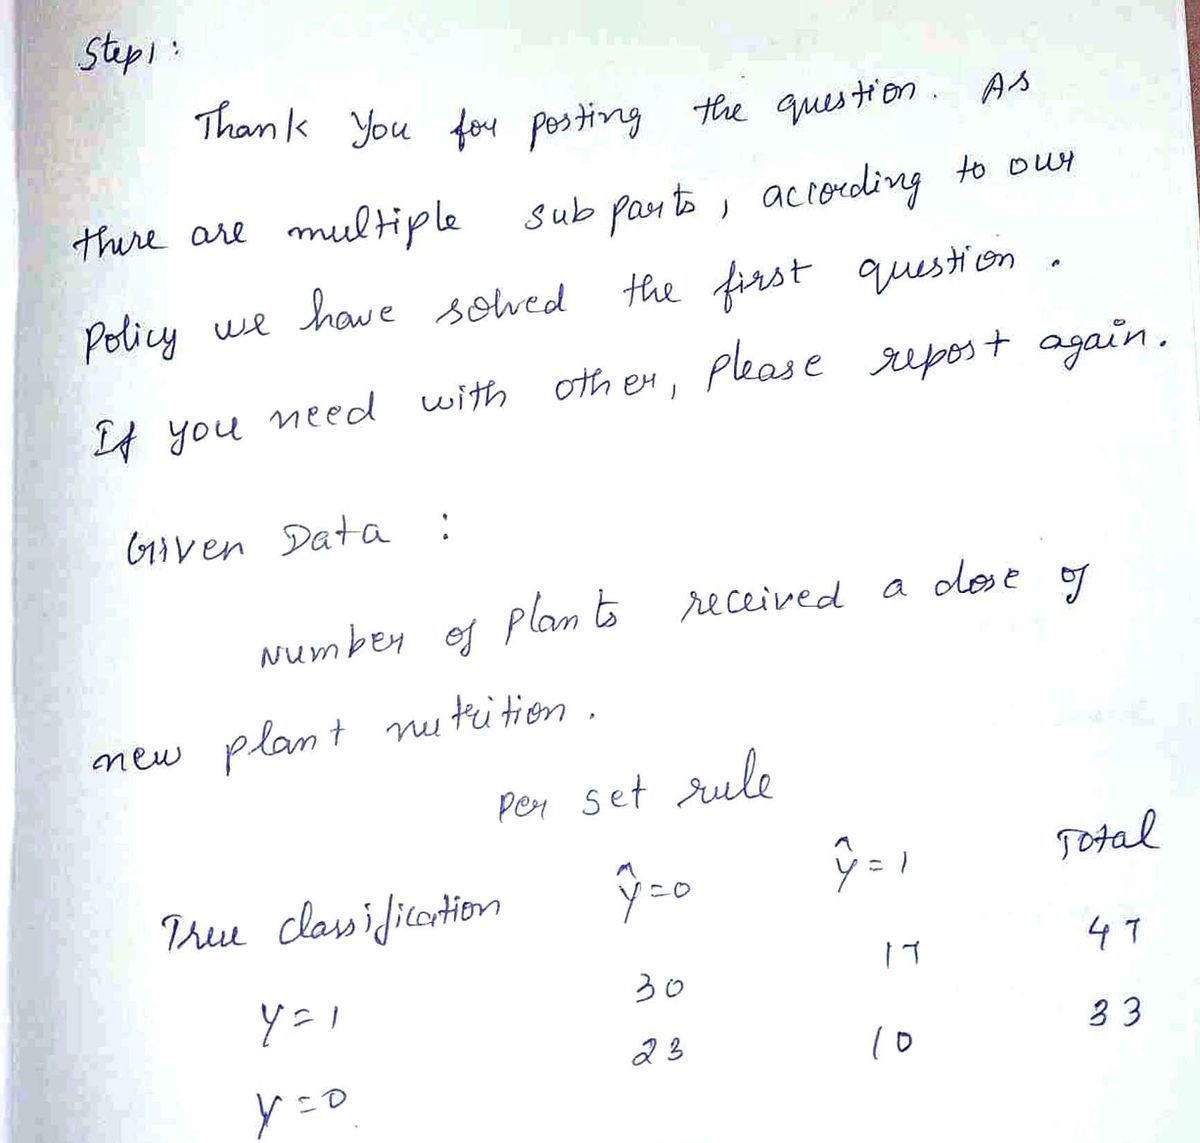
6. In a study a number of plants received a dose of a new plant nutrition. A week later, each plant was observed. A flowering plant was recorded as 1 and a plant without flowers was recorded as 0. The results are given in the table below and is based on the rule; Predict 1 if th≥ 0.6; predict 0 if ħ < 0.6 2 Per set rule
6. In a study a number of plants received a dose of a new plant nutrition. A week later, each plant was observed. A flowering plant was recorded as 1 and a plant without flowers was recorded as 0. The results are given in the table below and is based on the rule; Predict 1 if th≥ 0.6; predict 0 if ħ < 0.6 2 Per set rule

Glencoe Algebra 1, Student Edition, 9780079039897, 0079039898, 2018
18th Edition
ISBN:9780079039897
Author:Carter
Publisher:Carter
Chapter10: Statistics
Section10.6: Summarizing Categorical Data
Problem 23PPS

Related questions
Question

Transcribed Image Text:6. In a study a number of plants received a dose of a new plant nutrition. A week later, each plant was
observed. A flowering plant was recorded as 1 and a plant without flowers was recorded as 0. The
results are given in the table below and is based on the rule;
Predict 1 if th≥ 0.6; predict 0 if ft < 0.6
True classification
Y = 1
Y = 0
Y = 0
30
23
2
Per set rule
Ŷ = 1
17
10
Total
47
33
In order to make valid predictions for new observations, the prediction error rates must be
determined.
6.1. Find the prediction error rate.
6.2. Find the error rates for plants that flowered and those that have no flowers with the
nutrition added. Interpret this finding.
7. A visual tool to evaluate the model's predictive power is the ROC curve or the receiver operating
characteristic.
7.1. Find the values for sensitivity and 1- specificity. Draw a rough sketch of the ROC.
7.2. Assess the ROC plot in Question 1.9. Is the logistic model used for predicting the outcome of
flowers due to nutrient addition is a model? That is, it the logistic regression a good
predictor based on this rule. If not, what can be done?
Expert Solution
Step 1

Step by step
Solved in 3 steps with 3 images

Recommended textbooks for you
Glencoe Algebra 1, Student Edition, 9780079039897…
Algebra
ISBN:
9780079039897
Author:
Carter
Publisher:
McGraw Hill

Big Ideas Math A Bridge To Success Algebra 1: Stu…
Algebra
ISBN:
9781680331141
Author:
HOUGHTON MIFFLIN HARCOURT
Publisher:
Houghton Mifflin Harcourt

College Algebra (MindTap Course List)
Algebra
ISBN:
9781305652231
Author:
R. David Gustafson, Jeff Hughes
Publisher:
Cengage Learning
Glencoe Algebra 1, Student Edition, 9780079039897…
Algebra
ISBN:
9780079039897
Author:
Carter
Publisher:
McGraw Hill
Big Ideas Math A Bridge To Success Algebra 1: Stu…
Algebra
ISBN:
9781680331141
Author:
HOUGHTON MIFFLIN HARCOURT
Publisher:
Houghton Mifflin Harcourt
College Algebra (MindTap Course List)
Algebra
ISBN:
9781305652231
Author:
R. David Gustafson, Jeff Hughes
Publisher:
Cengage Learning

Holt Mcdougal Larson Pre-algebra: Student Edition…
Algebra
ISBN:
9780547587776
Author:
HOLT MCDOUGAL
Publisher:
HOLT MCDOUGAL

Functions and Change: A Modeling Approach to Coll…
Algebra
ISBN:
9781337111348
Author:
Bruce Crauder, Benny Evans, Alan Noell
Publisher:
Cengage Learning