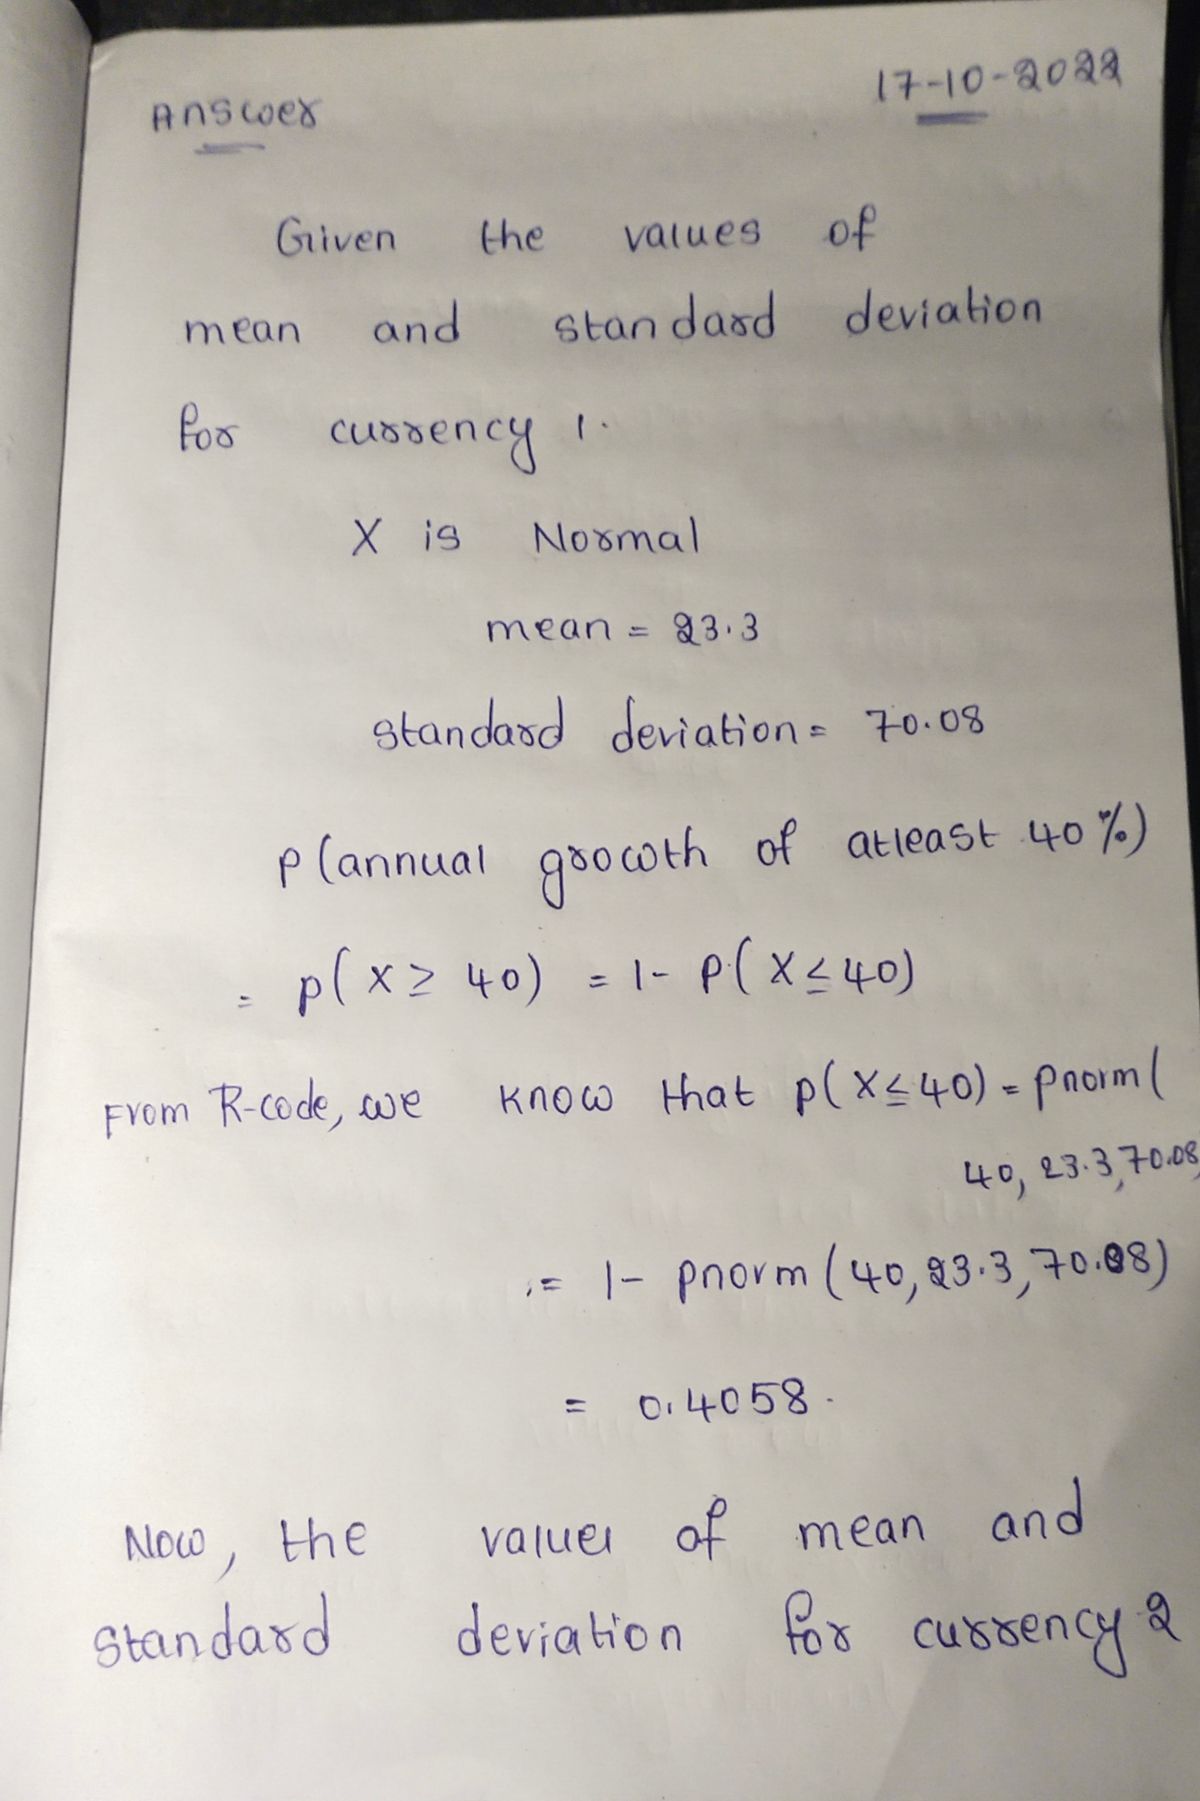
5. Changes in the value of two particular cryptocurrencies are modelled as Normal distributions. From year to year, the first cryptocurrency changes in value with mean 23.30% and standard deviation 70.08%. From year to year, the second cryptocurrency changes in value with 1 mean 46.40% and standard deviation 149.69%. An investor is hoping for an annual growth in value of at least 40%. Which currency is most likely to give an annual growth of at least 40%?
Q: 4. Let’s consider a company’s growth rate of sales. Year Annual Growth Rate (%) 1993 6.80 1994 6.10…
A: 1).The sample mean and standard deviation can be obtained using Minitab is as follows:Step-by-step…
Q: Suppose that the annual rate of return for a common biotechnology stock is normally distributed with…
A:
Q: The data for the number of hand-held gaming devices sold for the past 5 weeks are 20 units, 15…
A: We compute the 2 week moving averages as below: Weeks Number of devices Simple moving…
Q: According to an investment web site, the performance of two index funds in the past 10 years is…
A: Hi! As you haven not mentioned which question we need to solve so as our honor code we are…
Q: An investor can design a risky portfolio based on two stocks, A and B. Stock A has an expected…
A: A BExpected return on stock A21%Expected return on stock…
Q: A portfolio manager believes that tomorrow foreign exchange rate of the german ,marks per US dollar…
A:
Q: The following are monthly percentage price changes for three market indexes Month DJIA S&P 500…
A: Month DJIAS&P…
Q: (a) What percent of years does this portfolio lose money, i.e. have a return less than 0%? (b) What…
A: Let X be the random variable defined by returns on a portfolio follows normal distribution with mean…
Q: approximately normally distributed, find the probability that a randomly selected monthly payment…
A: The average monthly mortgage payment including principal and interest is P98200. If the standard…
Q: An investor wants to invest $300,000 in a portfolio of three mutual funds. The annual fund returns…
A: 2. To estimate the ending balance after the first year with the changed allocation (30% short-term,…
Q: The quarterly returns for a group of 78 mutual funds with a mean of 3.2% and a standard deviation of…
A:
Q: a) Assume a bank has a portfolio of stocks with a current market value of $4,000,000. If the recent…
A: Financial risk management is a critical aspect of managing the finances of any business or…
Q: Pak, with a seed of 1, to develop a Monte Carlos final answer to two decimal places. e after the…
A:
Q: 32. A stock has an average historical return of 11.3 percent and a standard deviation of 20.2…
A: The mean is μ=11.3The standard deviation is σ=20.2The objective is to choose the correct range of…
Q: What is the probability, p1, (assuming that the past pattern of variation continues) that the mean…
A:
Q: Compute the standard deviation of the R/USD data series 2. Describe the shape and skewness of both…
A: Standard deviation is for R/USD given by, Std dev=√ E(X2)-x̄2 Mean, x̄= ΣXi/n…
Q: Create embedded formulae which generate statistical properties of the portfolio upon insertion of…
A: In the given case the rate of return is given by the annual change in the value of the portfolio. So…
Q: 2. A rice retailer asserts that the average expiry of her Cindy Rice is 60 months. However, the…
A: The normal distribution in the center are generally denser and basically less denser at tails.…
Q: The Capital Asset Pricing Model (CAPM) is a financial model that assumes returns on a portfolio are…
A: Given that. X~N( μ , ?) μ=14.7 , ?=33 Z-score =( x - μ )/?
Q: Suppose that the annual rate of return for a common biotechnology stock is normally distributed with…
A:
Q: Use the following information to calculate the expected return and standard deviation of a portfolio…
A: The expected return and standard deviation of a portfolio are given below,3 Doors, IncDown…
Q: None
A: To conduct a Monte Carlo simulation with 1000 trials to estimate the mean ending balance after the…
Q: Suppose that you are considering an investment project with a two-year life. If the annual cash…
A: Given:
Q: Question- What is the standard deviation of this distribution? Note: Enter a numerical value only,…
A:
Q: u can just answer no. 2
A: 2) Given w1 = 0.30 w2 = 0.70 E[R1] = 0.1 E[R2] = 0.2 Var[R1] = 0.25 Var[R2] = 0.45 Correlation ρ =…
Q: 3. In the long run, anqual real returns on common stocks have been normally distributed with mean…
A: Note : "Since you have posted a question with multiple subparts, we will solve first three subparts…
Q: 20. Investing: Socially Responsible Mutual Funds Pax World Balanced is a highly respected, socially…
A: The sample coefficient of variation (CV) is defined to be
Q: The interest rate for the financing of a used car is on average 9% with a standard deviation of 3%.…
A:
Q: Pricing Exotic Options. A given stock is currently priced at$100. Historically, its annual return…
A: Given Solution:
Q: Stock A has an expected return of 10% and standar deviation of 20%. Stock B has an expected return…
A: Given that: For stock A: Expected return=10%=R1Standard deviation=20%=σ1 For stock B: Expected…
Q: 14.9. Estimate the expectation of life at the age of 16 year from the following data: Age in yrs:…
A:
Q: If the standard deviation of returns on the market is 10 percent, and the beta of a well-…
A: To calculate the standard deviation of a well-diversified portfolio (𝜎𝑝) where the beta (𝛽𝑝) of…
Q: his figure, presents the percentage deviation from the 60:40 ratio in the market values of equity of…
A: Given that,
Q: An investor recorded the following annual returns of one of his investments. You are required to…
A: Given Year 2016 2017 2018 2019 2020 Return 15% 17% 19% 10% -5%
Q: The lifetime of certain electronic components is assumed to have an exponential distribution.…
A: Hello! As you have posted more than 3 sub parts, we are answering the first 3 sub-parts. In case…
Q: Over the entire 20th century, the real (that is, adjusted for inflation) annual returns (in percent)…
A: Given, U.S. common stocks had mean 8.7 and standard deviation 20.25 and the distribution of annul…
Q: A fish restaurant sells fish for $50 per kg and buys it from the suppliers for $10 per kg. Fish that…
A: We have to find out the profit maximizing order using normal distribution
Q: Find these probabilities of the monthly payment selected randomly. Enter the final answers as…
A: Let X denote the mortgage payments. Given that X follows N(mean = 982, SD = 180), then Z = (X -…
Step by step
Solved in 2 steps with 2 images
- STATE: Andrew plans to retire in 4040 years. He plans to invest part of his retirement funds in stocks, so he seeks out information on past returns. He learns that from 1966 to 2015, the annual returns on S&P 500500 had mean 11.0%11.0% and standard deviation 17.0%17.0% . PLAN: The distribution of annual returns on common stocks is roughly symmetric, so the mean return over even a moderate number of years is close to Normal. We can use the Central Limit Theorem to make an inference. SOLVE: What is the probability, ?1p1 , assuming that the past pattern of variation continues, that the mean annual return on common stocks over the next 4040 years will exceed 10%10% ? (Enter your answer rounded to two decimal places.) What is the probability, ?2p2 , that the mean return will be less than 5%5% ? (Enter your answer rounded to two decimal places.). You make an investment. Assume that annual returns are normally distributed with a mean return of .05 per year and a standard deviation of .20. What is the probability of (a) a positive annual return? (b) What is the probability of an annual return greater than .12? (c) What is the probability of a return of –.06 or less? (d) Suppose there are 250 trading days in a year and the return on any day is independent of the return on any other day. What is the probability of a positive return on any given day?K A portfolio has 30% of its value in IBM shares and the rest in Microsoft (MSFT). The volatility of IBM and MSFT are 35% and 30%, respectively, and the correlation between IBM and MSFT is 0.4. What is the standard deviation of the portfolio? OA. 31.02% OB. 22.93% C. 26.97% OD. 29.67%
- I2 The market portfolio has an expected return of 10% and consists of 30% in stock and 70% in real estate, and the risk-free interest rate is 5%. Based on the single-factor CAPM model and the following information on stock and property returns: The standard deviation of stock performance: 0.2 The standard deviation of real estate performance: 0.1 The correlation between stock return and real estate return: 0.3 1. What is the expected return for the stock and real estate? ** Please show detailed calculationInvestors not only desire a high return on their money, but they would also like the rate of return to be stable (have a small volatility) from year to year. An investment manager invests with the goal of reducing volatility, measured by the standard deviation, to be less than 4.3. The following data represent the rate of return (in percent) for his mutual fund for the past 12 years. Taking the data as a random sample and assuming that the data follow a normal distribution, is there evidence to support the investor’s claim that his portfolio has a yearly volatility less than 4.3? Use α = 0.1 level of significance. 12.8 16.9 9.0 11.4 10.3 5.6 8.6 11.4 9.3 7.7 13.9 5.7 Hypotheses: Test statistic. Round to 3 decimals. Critical value(s). Round to 3 decimals. Conclusion in context.Andrew plans to retire in 30 years. He plans to invest part of his retirement funds in stocks, so he seeks out information on past returns. He learns that over the entire 20th century, the real (that is, adjusted for inflation) annual returns on U.S. common stocks had mean 8.7% and standard deviation 20.2%. The distribution of annual returns on common stocks is roughly symmetric, so the mean return over even a moderate number of years is close to Normal.What is the probability that the mean return will be less than 6%?
- Pax World Balanced is a highly respected, socially responsible mutual fund of stocks and bonds. Vanguard Balanced Index is another highly regarded fund that represents the entire U.S. stock and bond market (an index fund). The mean and standard deviation of annualized percent returns are shown below. The annualized mean and standard deviation are for a recent 10-years period.†. If x represents return and s represents risk, then explain why the coefficient of variation can be taken to represent risk per unit of return. From this point of view, which fund appears to be better? Explain. A. Since the CV is s/s2 we can say that the CV represents the risk per unit of return; the Pax fund appears to be better because the CV is smaller. B. Since the CV is s/s2 we can say that the CV represents the risk per unit of return; the Vanguard fund appears to be better because the CV is smaller. C. Since the CV is s/x we can say that the CV represents the risk per unit of return; the Pax fund…An investor wants to invest $300,000 in a portfolio of three mutual funds. The annual fund returns are normally distributed with a mean of 2.00% and standard deviation of 0.30% for the short-term investment fund, a mean of 5.00% and standard deviation of 2.50% for the intermediate-term fund, and a mean of 6.25% and standard deviation of 5.50% for the long-term fund. An initial plan for the investment allocation is 45% in the short-term fund, 35% in the intermediate-term fund, and 20% in the long-term fund. a. Use Analysis ToolPak, with a seed of 1, to develop a Monte Carlo simulation with 100 trials to estimate the mean ending balance after the first year. Note: Round the final answer to two decimal places. Mean ending balance after the first year b. If the allocation is changed to 30% short-term, 55% intermediate-term, and 15% long-term, estimate the ending balance after the first year. Note: Round the final answer to two decimal places. Mean ending balance after the first year c.…Observe the mean, the standard deviation, and the CV of the annual rate of return of the portfolio. Apple Historical Annual Stock Price Data Year Average Stock Price Year Open Year High Year Low Year Close Annual % Change 2021 135.6974 129.4100 156.6900 116.3600 148.7600 12.11% 2020 95.3468 75.0875 136.6900 56.0925 132.6900 80.75% 2019 52.0640 39.4800 73.4125 35.5475 73.4125 86.16% 2018 47.2634 43.0650 58.0175 36.7075 39.4350 -6.79% 2017 37.6378 29.0375 44.1050 29.0050 42.3075 46.11% 2016 26.1510 26.3375 29.5625 22.5850 28.9550 10.03% 2015 30.0096 27.3325 33.2500 25.7800 26.3150 -4.64% 2014 23.0661 19.7546 29.7500 17.8494 27.5950 37.72% 2013 16.8798 19.6082 20.3604 13.9475 20.0364 5.42% 2012 20.5732 14.6868 25.0750 14.6868 19.0062 31.40% 2011 13.0002 11.7704 15.0800 11.2614…
- Product failure behavior. An article in Hotwire (Dec. 2002) discussed the length of time till failure of a product pro- duced at Hewlett-Packard. At the end of the product’s life- time, the time till failure is modeled using an exponential distribution with mean 500 thousand hours. In reliability jargon, this is known as the “wear-out” distribution for the product. During its normal (useful) life, assume the prod- uct’s time till failure is uniformly distributed over the range 100 thousand to 1 million hours. a. At the end of the product’s lifetime, find the probability that the product fails before 700 thousand hours. b. During its normal (useful) life, find the probability that the product fails before 700 thousand hours. c. Show that the probability of the product failing before 830 thousand hours is approximately the same for both the normal (useful) life distribution and the wear-out distributionSuppose that the value of an index of the stock market increases on average about 0.02% per day (calculated with continuous discounting) and a volatility (i.e., standard deviation) of 1% per day. Assuming that the returns are Normally distributed, what would be the 5% Daily Expected Shortfall (ES) expressed as a percent return? (Note: Enter your answer rounded to the nearest 2 decimal places. (For example, -1.2345% should be entered as -1.23%).has conducted recently a research-study on price behaviour of three leading industrial shares, A, B and C for the The Shareholders Research Centre period 2012 to 2017. The results are published in the Quarterly Journal : Average Price Share Standard Deviation Current Selling Price A 18.2 5.4 36.00 22.5 4.5 34.75 24.0 6.0 39.00 The above figures are given in (a) Which share, in your opinion, appear to be more stable in value ? (h If you are the holder of all the three shares, which one would you like to dispose of ot present, and why ?