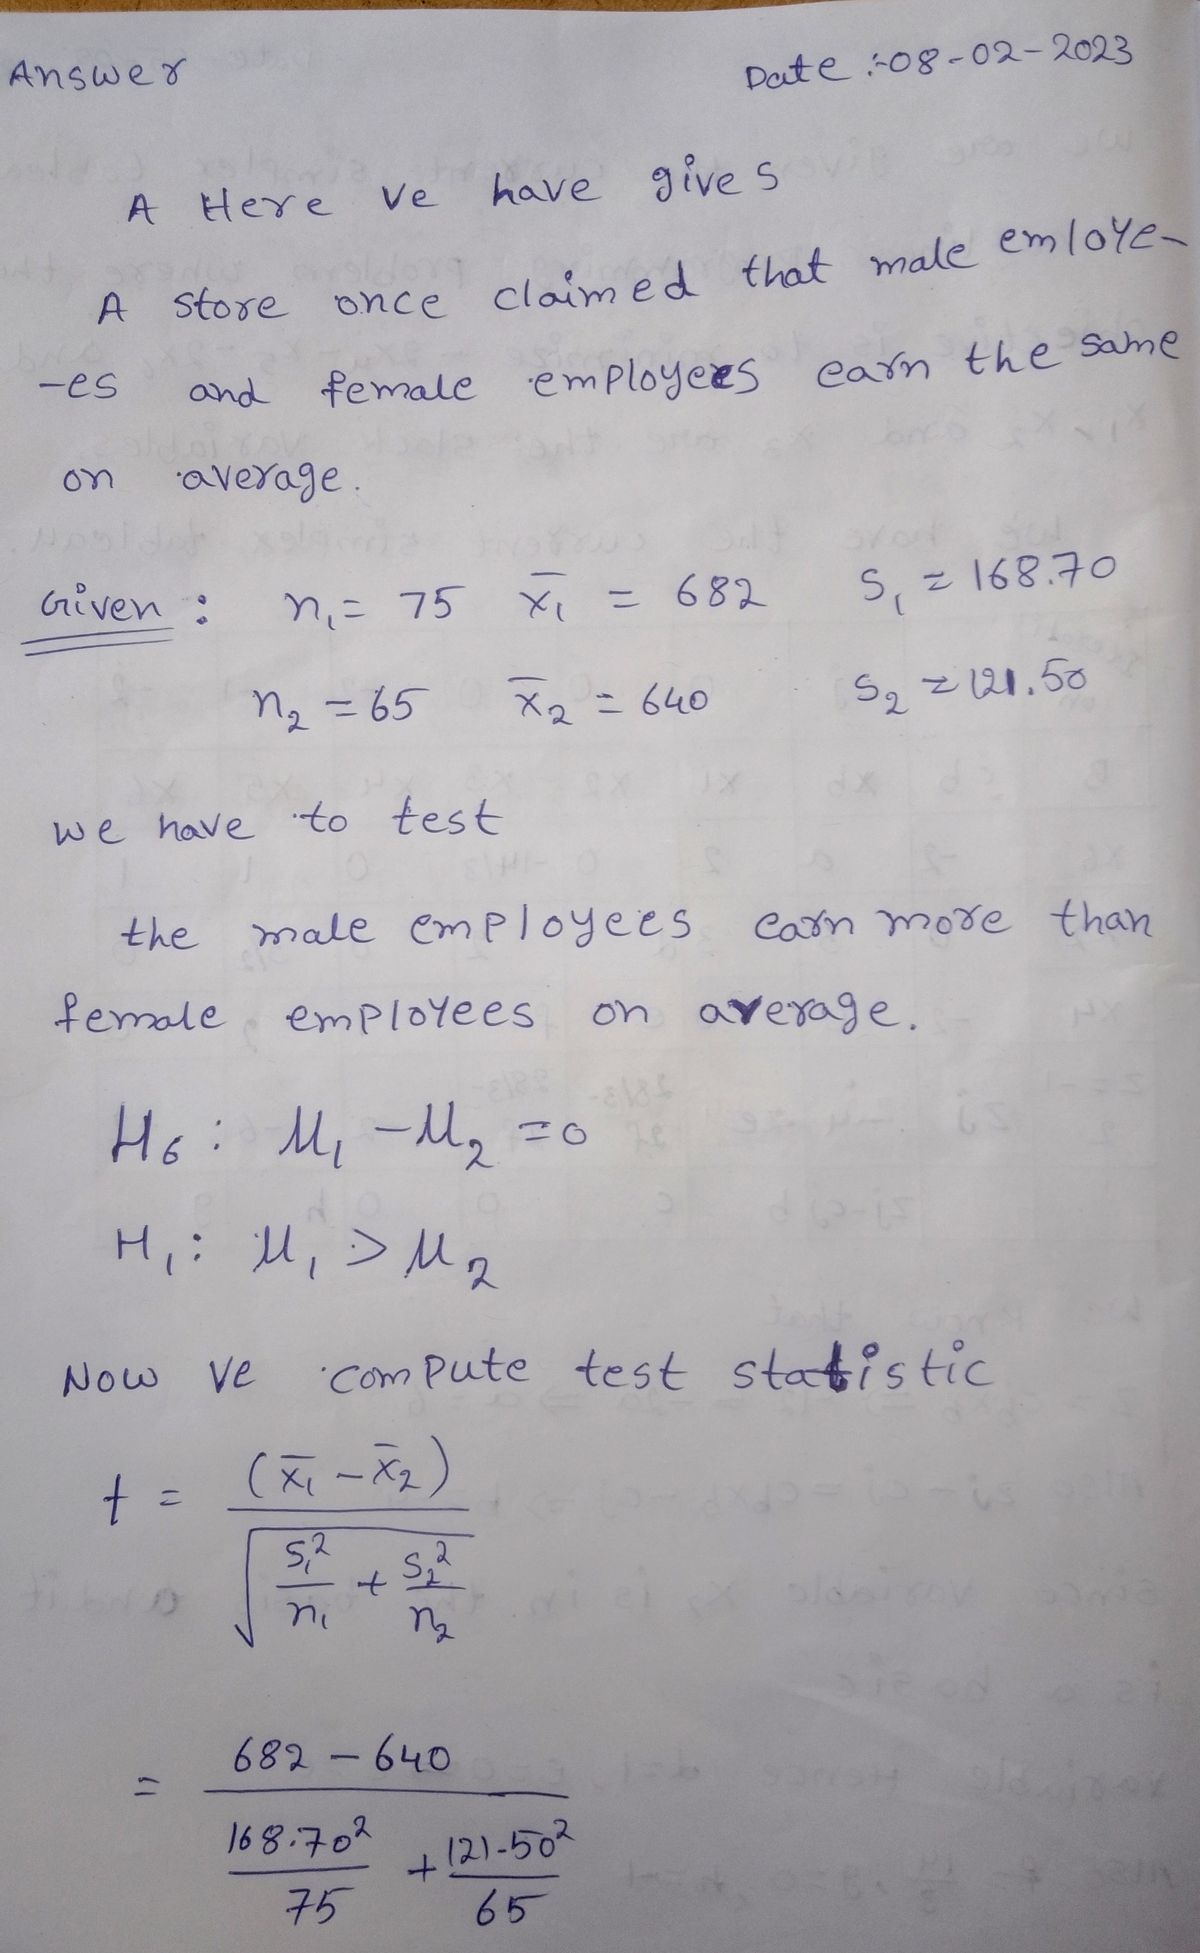
5) (11.3) A store once claimed that male employees and female employees earn the same on average. A worker's spouse at that same local store wondered if men at her store made more on average and decided to run a study. Of 65 female employees who were randomly selected, it was found that their mean monthly income was $640 with a standard deviation of $121.50. Of seventy-five male employees who were also randomly selected, their mean monthly income was found to be $682 with a standard deviation of $168.70. Test the spouse's claim that male employees earn more than female employees on average. Use a = 0.01. Label your Ho and H₁, determine the p-value, state whether you reject or don't reject Ho then state a formal conclusion.
Q: Fran is training for her first marathon, and she wants to know if there is a significant difference…
A: The objective of this question is to test the claim that there is a significant difference between…
Q: One year Thomas had the lowest ERA (earned-run average, mean number of runs yielded per nine innings…
A:
Q: A new small business wants to know if its current radio advertising is effective. The owners decide…
A: The objective of this question is to test the claim that the mean number of customers who make a…
Q: One year Thomas had the lowest ERA (earned-run average, mean number of runs yielded per nine…
A: We have given that X~N( μ , ?^2 ) Z-score =( x - μ )/?
Q: The Pew Internet and American Life Project surveyed 2227 adults in 2011, asking them about their…
A: It is given that the mean number of text messages sent per day is 40.9 for men, 42.0 for women. The…
Q: Fran is training for her first marathon, and she wants to know if there is a significant difference…
A: Let be the group runners training for marathons be population 1 and be the individual runners…
Q: Fran is training for her first marathon, and she wants to know if there is a significant difference…
A: Sample mean (x̅1) = 42.8Sample mean (x̅2) = 40.9Sample size (n1) = 34Sample size (n2) = 41Standard…
Q: The National Sleep Foundation surveyed representative samples of adults in six different countries…
A: we have given that n1=250 ,n2=250 ,xbar1=391 ,xbar2=426 ,s1=20 ,s2=44 alpha=0.05
Q: The U.S. Center for Disease Control reports that the mean life expectancy was 47.6 years for whites…
A: From the provided information,
Q: Fran is training for her first marathon, and she wants to know if there is a significant difference…
A: The objective of this question is to test the claim that there is a significant difference between…
Q: Is it worth pursuing a doctoral degree in education if you already have an undergraduate degree? One…
A: Obtain the 99% confidence interval to estimate the true difference between the mean salaries for…
Q: In 1995, Cook County, Illinois (1.4 million households), conducted a study to determine how far the…
A: N=2518 Mean =42.6 Standard deviation =16.7 Average =42 We have to test hypothesis.
Q: 3. In 1988 Wood, et al, did a study. Eighty-nine sedentary men were given one of two treatments.…
A: Diet:Sample size Sample mean Sample standard deviation Exercise:Sample size Sample mean Standard…
Q: A new small business wants to know if its current radio advertising is effective. The owners decide…
A: Given Data : For Sample 1 x̄1 = 18.3 s1 = 1.8 n1 = 10 For Sample 2…
Q: The National Center for Health Statistics reports that the average systolic blood pressure for males…
A: Here, The claim to be tested is "The medical director of a large company believes the average…
Q: Fran is training for her first marathon, and she wants to know if there is a significant difference…
A: Solution
Q: A researcher wants to examine whether VCU students send and receive fewer texts per day than the…
A:
Q: ates, two color variants of the Eastern Gray Squirrel-gray and black-are found in the rrels in a…
A:
Q: Population 2. Step 2 of 3: Compute the value of the test statistic. Round your answer to three…
A: It is given thatFor sample 1:n1=13,x1¯=23.9,s1=1.9n2=6,x2¯=24.7,s2=1.6α=0.01
Q: The U.S. Center for Disease Control reports that the mean life expectancy was 47.6 years for whites…
A: a.) The Hypotheses The hypotheses are: H0:μW=μNWH1:μW=μNW b.) The Test Statistic The…
Q: Are low-fat diets or low-carb diets more effective for weight loss? This question was addressed by a…
A: Given that, for a low-carbohydrate diet n1=77, x1=4.7 kg, s1=7.2 kg For a low-fat diet, n2=79,…
Q: Is it worth pursuing a doctoral degree in education if you already have an undergraduate degree? One…
A: Let Population 1 be the salaries for people with doctoral degrees and Population 2 be the salaries…
Q: Find their respective z-scores. Which player had the better year relative to their peers, Hank or…
A: Given For males, μ=4.296σ=0.907 For females μ=3.764σ=0.866
Q: The National Center for Health Statistics reported that the mean total cholesterol level in 2002 for…
A:
Q: A new small business wants to know if its current radio advertising is effective. The owners decide…
A: The objective of this question is to test the claim that the mean number of customers who make a…
Q: According to the Bureau of Labor Statistics, the mean salary for registered nurses in Kentucky was…
A: Central Limit Theorem for mean: If a random sample of size n is taken from a population having mean…
Q: State the appropriate null and alternative hypotheses. Ο H μ 906 H: H 906 H: u 906 Ο H: μ 906 H:u…
A: The appropriate null and alternative hypotheses are given below: Here, µ is the true mean balance.…
Q: Fran is training for her first marathon, and she wants to know if there is a significant difference…
A: From the provided information,
Q: Ted had the lowest ERA (earned-run average, mean number of runs yielded per nine innings pitched)…
A: According to the given information in this question We need to find the z score
Q: One year thomas had the lowest ERA (earned-run average, mean number of runs yielded per nine…
A: GivenThomas has an ERA of 2.67 and Sarah has an ERA of 2.99For males,For femalesTo find the z-score…
Q: Fran is training for her first marathon, and she wants to know if there is a significant difference…
A: Given data,n1=40x1=46.6σ1=4.6n2=45x2=48.8σ2=2.4Compute value of test statistic?
Q: Is it worth pursuing a doctoral degree in education if you already have an undergraduate degree? One…
A: The sample size for population 1 is 16, sample mean is 47000 and sample standard deviation is 5200.…
Q: A new small business wants to know if its current radio advertising is effective. The owners decide…
A: The objective of this question is to test the claim that the mean number of customers who make a…
Q: Fran is training for her first marathon, and she wants to know if there is a significant difference…
A: Let be the group runners training for marathons be population 1 and be the individual…
Q: At MJC's intramural sports program, the time to run one mile is recorded for 200 male students In…
A: Given 200 male student participated in program Mean = 8. Std deviation = 1 50 female student…
Q: A new small business wants to know if its current radio advertising is effective. The owners decide…
A: The sample size for no advertising group is 13, sample mean is 23.8 and sample standard deviation is…
Q: Do female college students spend more time than male college students watching TV? This was one of…
A: Let μMales be the mean time spent watching TV per day by males and μFemales be the mean time spent…
Q: A report about how American college students manage their finances includes data from a survey of…
A:
Q: For a new study conducted by a fitness magazine, 255 females were randomly selected. For each, the…
A: Given a study conducted by a fitness magazine, 255 females were randomly selected. For each, the…
Q: A new small business wants to know if its current radio advertising is effective. The owners decide…
A: From the provided information,
Q: Is it worth pursuing a doctoral degree in education if you already have an undergraduate degree? One…
A: The sample size for population 1 is 15, sample mean is 50000 and sample standard deviation is 9200.…
Q: ne year Terry had the lowest ERA (eamed-run average, mean number of runs yielded per nine inhings…
A: According to the given information in this question we need to find the z scores of both
Q: A new small business wants to know if its current radio advertising is effective. The owners decide…
A: The objective of this question is to test the claim that the mean number of customers who make a…
Q: One year Perry had the lowest ERA (earned-run average, mean number of runs yielded per nine innings…
A: Perry had the lowest ERA (earned-run average, mean number of runs yielded per nine innings…
Q: A new small business wants to know if its current radio advertising is effective. The owners decide…
A:
Trending now
This is a popular solution!
Step by step
Solved in 2 steps with 2 images
- Participants were enrolled in a health-coaching program for eight weeks to try to improve physical health and overall wellness. At the end of the trial period, the participants take a personal health improvement survey. The mean health improvement survey score for all participants in the program was 74.4 with a standard deviation of 10.3. We have reason to think that one of the health coaches (Coach A) who participated in an additional training program will have subjects who have higher health improvement survey scores than the overall program average. We know that Coach A trains 30 subjects with the average health improvement survey score of 80.1. a) We want to test the hypothesis that subjects who work with Coach A have higher health improvement survey scores compared with the rest of the program participants. Use alpha of 0.05 b) Suppose a continuous random variable can only take on values between −1 and +1 on a standard normal curve, what is the area under the curve? Use…One year Perry had the lowest ERA (earned-run average, mean number of runs yielded per nine innings pitched) of any male pitcher at his school, with an ERA of 2.57. Also, Rita had the lowest ERA of any female pitcher at the school with an ERA of 3.26. For the males, the mean ERA was 4.304 and the standard deviation was 0.894. For the females, the mean ERA was 4.158 and the standard deviation was 0.519. Find their respective z-scores. Which player had the better year relative to their peers, Perry or Rita? (Note: In general, the lower the ERA, the better the pitcher.) Perry had an ERA with a z-score of Rita had an ERA with a z-score of (Round to two decimal places as needed.) Textbook Get more help - $ 1 G Search or type URL % 31 6 & 7 * 8 + ( 9 0 Clear all + Check answer deleteOne year Terry had the lowest ERA (earned-run average, mean number of runs yielded per nine innings pitched) of any male pitcher at his school, with an ERA of 3.02. Also, Karen had the lowest ERA of any female pitcher at the school with an ERA of 3.24. For the males, the mean ERA was 4.364 and the standard deviation was 0.639. For the females, the mean ERA was 3.801 and the standard deviation was 0.959 Find their respective z-scores. Which player had the better year relative to their peers, Terry or Karen? (Note: In general, the lower the ERA, the better the pitcher.) Terry had an ERA with a z-score of Karen had an ERA with a z-score of (Round to two decimal places as needed) Which player had a better year in comparison with their peers? OA. Terry had a better year because of a higher z-score. OB. Karen had a better year because of a lower z-score. OC. Terry had a better year because of a lower z-score. O D. Karen had a better year because of a higher z-score. GIL
- Fran is training for her first marathon, and she wants to know if there is a significant difference between the mean number of miles run each week by group runners and individual runners who are training for marathons. She interviews 37 randomly selected people who train in groups, and finds that they run a mean of 47.7 miles per week. Assume that the population standard deviation for group runners is known to be 3.3 miles per week. She also interviews a random sample of 49 people who train on their own and finds that they run a mean of 49.4 miles per week. Assume that the population standard deviation for people who run by themselves is 4.4 miles per week. Test the claim at the 0.10 level of significance. Let group runners training for marathons be Population 1 and let individual runners training for marathons be Population 2. Step 2 of 3 : Compute the value of the test statistic. Round your answer to two decimal places.Fran is training for her first marathon, and she wants to know if there is a significant difference between the mean number of miles run each week by group runners and individual runners who are training for marathons. She interviews 42 randomly selected people who train in groups and finds that they run a mean of 47.1 miles per week. Assume that the population standard deviation for group runners is known to be 4.4 miles per week. She also interviews a random sample of 47 people who train on their own and finds that they run a mean of 48.5 miles per week. Assume that the population standard deviation for people who run by themselves is 1.8 miles per week. Test the claim at the 0.01 level of significance. Let group runners training for marathons be Population 1 and let individual runners training for marathons be Population 2. Step 2 of 3 : Compute the value of the test statistic. Round your answer to two decimal places.A new small business wants to know if its current radio advertising is effective. The owners decide to look at the mean number of customers who make a purchase in the store on days immediately following days when the radio ads are played as compared to the mean for those days following days when no radio advertisements are played. They found that for 1010 days following no advertisements, the mean was 18.618.6 purchasing customers with a standard deviation of 1.51.5 customers. On 77 days following advertising, the mean was 20.320.3 purchasing customers with a standard deviation of 0.90.9 customers. Test the claim, at the 0.020.02 level, that the mean number of customers who make a purchase in the store is lower for days following no advertising compared to days following advertising. Assume that both populations are approximately normal and that the population variances are equal. Let days following no advertisements be Population 1 and let days following advertising be Population 2.…
- A new small business wants to know if its current radio advertising is effective. The owners decide to look at the mean number of customers who make a purchase in the store on days immediately following days when the radio ads are played as compared to the mean for those days following days when no radio advertisements are played. They found that for 10 days following no advertisements, the mean was 18.3 purchasing customers with a standard deviation of 1.8 customers. On 7 days following advertising, the mean was 19.4 purchasing customers with a standard deviation of 1.6 customers. Test the claim, at the 0.02 level, that the mean number of customers who make a purchase in the store is lower for days following no advertising compared to days following advertising. Assume that both populations are approximately normal and that the population variances are equal. Let days following no advertisements be Population 1 and let days following advertising be Population 2. Step 3 of 3: Draw a…A report about how American college students manage their finances includes data from a survey of college students. Each person in a representative sample of 793 college students was asked if they had one or more credit cards and if so, whether they paid their balance in full each month. There were 500 who paid in full each month. For this sample of 500 students, the sample mean credit card balance was reported to be $825. The sample standard deviation of the credit card balances for these 500 students was not reported, but for purposes of this exercise, suppose that it was $205. Is there convincing evidence that college students who pay their credit card balance in full each month have a mean balance that is lower than $907, the value reported for all college students with credit cards? Carry out a hypothesis test using a significance level of 0.01. State the appropriate null and alternative hypotheses. H0: ? = 907 Ha: ? < 907 H0: ? = 907 Ha: ? > 907 H0: ? < 907…A new small business wants to know if its current radio advertising is effective. The owners decide to look at the mean number of customers who make a purchase in the store on days immediately following days when the radio ads are played as compared to the mean for those days following days when no radio advertisements are played. They found that for 7 days following no advertisements, the mean was 22.1 purchasing customers with a standard deviation of 1.2 customers. On 10 days following advertising, the mean was 24.1 purchasing customers with a standard deviation of 1.6 customers. Test the claim, at the 0.05 level, that the mean number of customers who make a purchase in the store is lower for days following no advertising compared to days following advertising. Assume that both populations are approximately normal and that the population variances are equal. Let days following no advertisements be Population 1 and let days following advertising be Population 2. Step 1 of 3: State the…
- A new small business wants to know if its current radio advertising is effective. The owners decide to look at the mean number of customers who make a purchase in the store on days immediately following days when the radio ads are played as compared to the mean for those days following days when no radio advertisements are played. They found that for 13 days following no advertisements, the mean was 23.9 purchasing customers with a standard deviation of 1.9 customers. On 6 days following advertising, the mean was 24.7 purchasing customers with a standard deviation of 1.6 customers. Test the claim, at the 0.01 level, that the mean number of customers who make a purchase in the store is lower for days following no advertising compared to days following advertising. Assume that both populations are approximately normal and that the population variances are equal. Let days following no advertisements be Population 1 and let days following advertising be Population 2. Step 3 of 3: Draw a…One year Hank had the lowest ERA (earned-run average, mean number of runs yielded per nine innings pitched) of any male pitcher at his school, with an ERA of 3.09. Also, Karen had the lowest ERA of any female pitcher at the school with an ERA of 2.98. For the males, the mean ERA was 4.635 and the standard deviation was 0.576. For the females, the mean ERA was 4.469 and the standard deviation was 0.944. Find their respective z-scores. Which player had the better year relative to their peers, Hank or Karen? (Note: In general, the lower the ERA, the better the pitcher.) Hank had an ERA with a z-score of Karen had an ERA with a z-score of (Round to two decimal places as needed.) Which player had a better year in comparison with their peers?According to the Bureau of Labor Statistics, the mean salary for registered nurses in Kentucky was $55,130. The distribution of salaries is assumed to be normally distributed with a standard deviation of $5,778. Someone would like to determine if registered nurses in Ohio have a greater average pay. To investigate this claim, a sample of 220 registered nurses is selected from the Ohio Board of Nursing, and each is asked their annual salary. The mean salary for this sample of 220 nurses is found to be $55,504.488. Completely describe the sampling distribution of the sample mean salary when samples of size 220 are selected. mean: μ x-bar = ____ standard deviation: σ x-bar = ____ shape: the distribution of is ____________(not normally distributed/normally distributed) because ___________ (the sample size is large/the sample size is not large/the population of salaries is normally distributed/the population of salaries is not normally distributed)