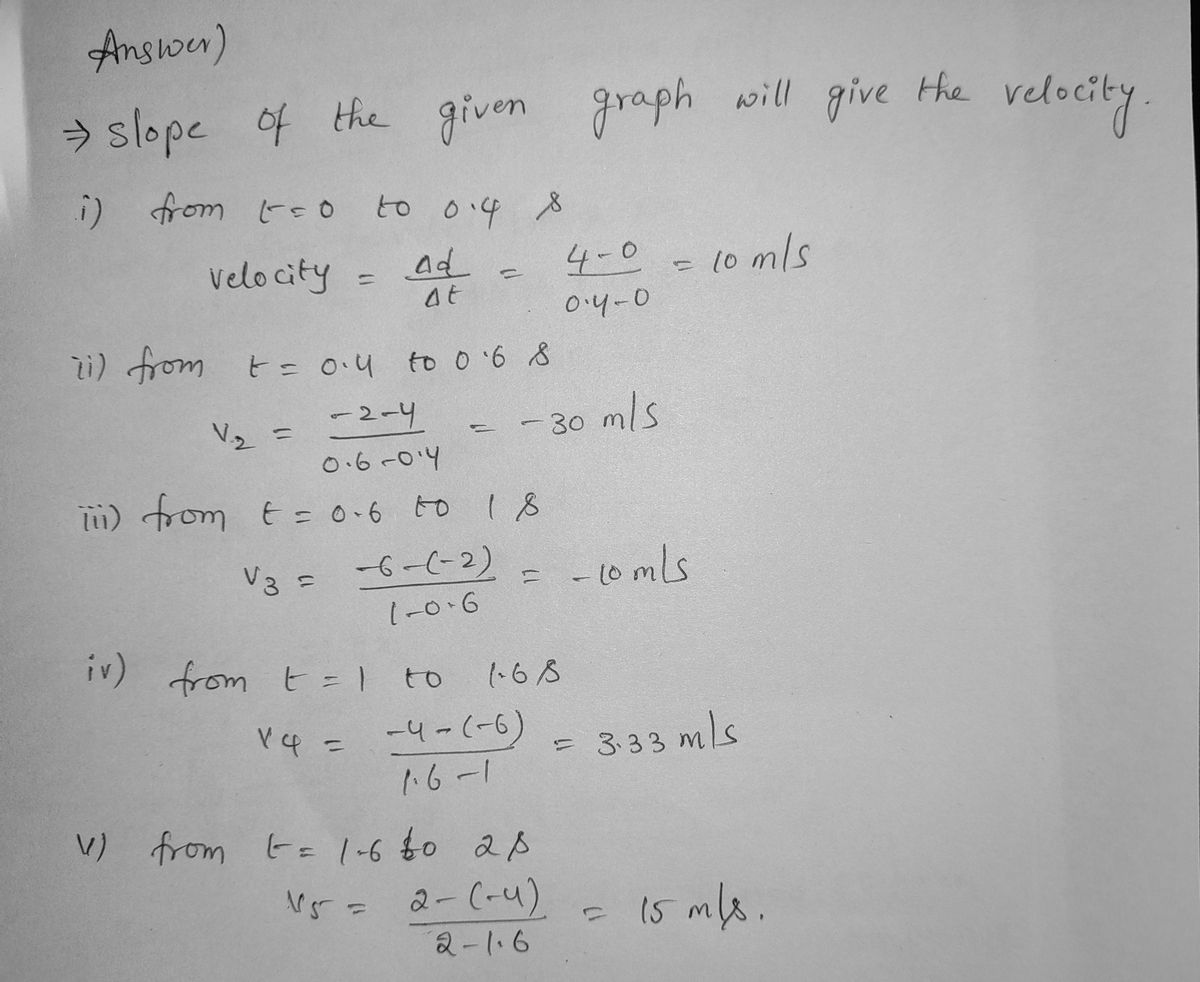
31. Sketch the velocity-versus-time Position (m) 10 860 4 N O * -4 -6 -8 -10 0 0.2 graph from the following position-versus-time graph. Position vs. Time 1 0.4 0.6 0.8 1.2 1.4 1.6 1.8 1 Time (s) I 2
31. Sketch the velocity-versus-time Position (m) 10 860 4 N O * -4 -6 -8 -10 0 0.2 graph from the following position-versus-time graph. Position vs. Time 1 0.4 0.6 0.8 1.2 1.4 1.6 1.8 1 Time (s) I 2

Related questions
Question

Transcribed Image Text:31. Sketch the velocity-versus-time
Position (m)
10
8
6
4
N
-4
-6
-8
-10
0
graph from the following position-versus-time graph.
Position vs. Time
1
1
0.2 0.4 0.6 0.8
1 1.2 1.4 1.6 1.8
Time (s)
1
-N
2
32 Sketch the velocity-versus-time graph from the following position-versus-time graph.
Expert Solution
Step 1

Step by step
Solved in 2 steps with 2 images
