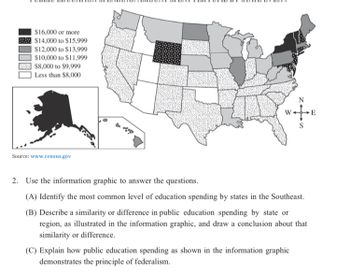
$16,000 or more $14,000 to $15,999 $12,000 to $13,999 $10,000 to $11,999 $8,000 to $9,999 Less than $8,000 Source: www.census.gov N WE S 2. Use the information graphic to answer the questions. (A) Identify the most common level of education spending by states in the Southeast. (B) Describe a similarity or difference in public education spending by state or region, as illustrated in the information graphic, and draw a conclusion about that similarity or difference. (C) Explain how public education spending as shown in the information graphic demonstrates the principle of federalism.
$16,000 or more $14,000 to $15,999 $12,000 to $13,999 $10,000 to $11,999 $8,000 to $9,999 Less than $8,000 Source: www.census.gov N WE S 2. Use the information graphic to answer the questions. (A) Identify the most common level of education spending by states in the Southeast. (B) Describe a similarity or difference in public education spending by state or region, as illustrated in the information graphic, and draw a conclusion about that similarity or difference. (C) Explain how public education spending as shown in the information graphic demonstrates the principle of federalism.
Oh no! Our experts couldn't answer your question.
Don't worry! We won't leave you hanging. Plus, we're giving you back one question for the inconvenience.
Submit your question and receive a step-by-step explanation from our experts in as fast as 30 minutes.
You have no more questions left.
Message from our expert:
Your Political Science question does not match the subject you selected. Please ask a question in one of the 30+ subjects available. We've credited a question to your account.
Your Question:

Transcribed Image Text:$16,000 or more
$14,000 to $15,999
$12,000 to $13,999
$10,000 to $11,999
$8,000 to $9,999
Less than $8,000
Source: www.census.gov
N
WE
S
2. Use the information graphic to answer the questions.
(A) Identify the most common level of education spending by states in the Southeast.
(B) Describe a similarity or difference in public education spending by state or
region, as illustrated in the information graphic, and draw a conclusion about that
similarity or difference.
(C) Explain how public education spending as shown in the information graphic
demonstrates the principle of federalism.
Knowledge Booster
Learn more about
Need a deep-dive on the concept behind this application? Look no further. Learn more about this topic, economics and related others by exploring similar questions and additional content below.Recommended textbooks for you

Principles of Economics 2e
Economics
ISBN:
9781947172364
Author:
Steven A. Greenlaw; David Shapiro
Publisher:
OpenStax


Managerial Economics: Applications, Strategies an…
Economics
ISBN:
9781305506381
Author:
James R. McGuigan, R. Charles Moyer, Frederick H.deB. Harris
Publisher:
Cengage Learning

Principles of Economics 2e
Economics
ISBN:
9781947172364
Author:
Steven A. Greenlaw; David Shapiro
Publisher:
OpenStax


Managerial Economics: Applications, Strategies an…
Economics
ISBN:
9781305506381
Author:
James R. McGuigan, R. Charles Moyer, Frederick H.deB. Harris
Publisher:
Cengage Learning

Brief Principles of Macroeconomics (MindTap Cours…
Economics
ISBN:
9781337091985
Author:
N. Gregory Mankiw
Publisher:
Cengage Learning

Principles of Economics (MindTap Course List)
Economics
ISBN:
9781305585126
Author:
N. Gregory Mankiw
Publisher:
Cengage Learning

Essentials of Economics (MindTap Course List)
Economics
ISBN:
9781337091992
Author:
N. Gregory Mankiw
Publisher:
Cengage Learning
