2) The linear correlation coefficient is r= ​(Round to three decimal places as​ needed.)   3) Determine the null and alternative hypotheses.

MATLAB: An Introduction with Applications
6th Edition
ISBN:9781119256830
Author:Amos Gilat
Publisher:Amos Gilat
Chapter1: Starting With Matlab
Section: Chapter Questions
Problem 1P
icon
Related questions
Question

1) Check Image

2)

The linear correlation coefficient is r=

​(Round to three decimal places as​ needed.)


3)

Determine the null and alternative hypotheses.

H0​: ρ

H1​: ρ

​(Type integers or decimals. Do not​ round.)


4)

The test statistic is t=

​(Round to three decimal places as​ needed.)


5)

The​ P-value is

​(Round to three decimal places as​ needed.)


6)

Because the​ P-value of the linear correlation coefficient is?             the significance​ level, there?    sufficient evidence to support the claim that there is a linear correlation between bill amounts and tip amounts.

7)

If everyone were to tip with the same​ percentage, then r=     .

​(Round to three decimal places as​ needed.)

Listed below are amounts of bills for dinner and the amounts of the tips that were left. Construct a scatterplot, find the value of the linear correlation coefficient r, and find the P-value of r. Determine whether there is sufficient
evidence to support a claim of linear correlation between the two variables. Use a significance level of a = 0.05. If everyone were to tip with the same percentage, what should be the value of r?
Bill (dollars)
Tip (dollars)
33.25
51.01
92.16 104.77 63.17 108.05 D
4.09
5.43
9.99
18.29
6.07 12.97
.....
Construct a scatterplot. Choose the correct graph below.
O A.
O B.
OC.
OD.
OD.
25-
25-
25-
25-
Q
0+
30
Bill Amount (S)
0-
30
Bill Amount (S)
0+
30
Bill Amount (S)
120
120
120
30
120
Bill Amount (S)
Tip Amount ($
"ip Amount ($)
ip Amount ($)
Transcribed Image Text:Listed below are amounts of bills for dinner and the amounts of the tips that were left. Construct a scatterplot, find the value of the linear correlation coefficient r, and find the P-value of r. Determine whether there is sufficient evidence to support a claim of linear correlation between the two variables. Use a significance level of a = 0.05. If everyone were to tip with the same percentage, what should be the value of r? Bill (dollars) Tip (dollars) 33.25 51.01 92.16 104.77 63.17 108.05 D 4.09 5.43 9.99 18.29 6.07 12.97 ..... Construct a scatterplot. Choose the correct graph below. O A. O B. OC. OD. OD. 25- 25- 25- 25- Q 0+ 30 Bill Amount (S) 0- 30 Bill Amount (S) 0+ 30 Bill Amount (S) 120 120 120 30 120 Bill Amount (S) Tip Amount ($ "ip Amount ($) ip Amount ($)
Expert Solution
Step 1

Hello! As you have posted more than 3 sub parts, we are answering the first 3 sub-parts.  In case you require the unanswered parts also, kindly re-post that parts separately.

Scatter plot:

Excel Procedure:

Enter  x and y in Excel sheet>Select the columns of x and y> Insert>“Insert scatter or bubble chart” option>Scatter under Charts.

Excel Output:

Statistics homework question answer, step 1, image 1

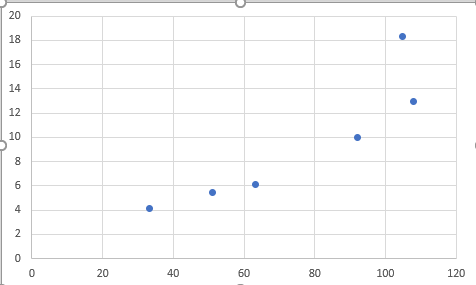
Correct option: option C.

trending now

Trending now

This is a popular solution!

steps

Step by step

Solved in 3 steps with 2 images

Blurred answer
Similar questions
  • SEE MORE QUESTIONS
Recommended textbooks for you
MATLAB: An Introduction with Applications
Statistics
ISBN:
9781119256830
Author:
Amos Gilat
Publisher:
John Wiley & Sons Inc
Probability and Statistics for Engineering and th…
Statistics
ISBN:
9781305251809
Author:
Jay L. Devore
Publisher:
Cengage Learning
Statistics for The Behavioral Sciences (MindTap C…
Statistics
ISBN:
9781305504912
Author:
Frederick J Gravetter, Larry B. Wallnau
Publisher:
Cengage Learning
Elementary Statistics: Picturing the World (7th E…
Statistics
ISBN:
9780134683416
Author:
Ron Larson, Betsy Farber
Publisher:
PEARSON
The Basic Practice of Statistics
Statistics
ISBN:
9781319042578
Author:
David S. Moore, William I. Notz, Michael A. Fligner
Publisher:
W. H. Freeman
Introduction to the Practice of Statistics
Statistics
ISBN:
9781319013387
Author:
David S. Moore, George P. McCabe, Bruce A. Craig
Publisher:
W. H. Freeman