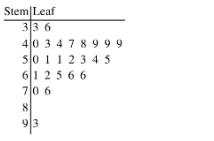
2) A survey was conducted to determine how people feel about the quality of programming available on television. Respondents were asked to rate the overall quality from 0 (no quality at all) to 100 (extremely good quality). The stem-and-leaf display of the data is shown below. Stem|Leaf 33 6 4|0 3 478999 50 1123 4 5 6125 6 6 70 6 93 6. What percentage of the respondents rated overall television quality as very good (regarded as ratings of 80 and above)? A) 1% B) 4% C) 12% D) 3%
2) A survey was conducted to determine how people feel about the quality of programming available on television. Respondents were asked to rate the overall quality from 0 (no quality at all) to 100 (extremely good quality). The stem-and-leaf display of the data is shown below. Stem|Leaf 33 6 4|0 3 478999 50 1123 4 5 6125 6 6 70 6 93 6. What percentage of the respondents rated overall television quality as very good (regarded as ratings of 80 and above)? A) 1% B) 4% C) 12% D) 3%

MATLAB: An Introduction with Applications
6th Edition
ISBN:9781119256830
Author:Amos Gilat
Publisher:Amos Gilat
Chapter1: Starting With Matlab
Section: Chapter Questions
Problem 1P

Related questions

Topic Video
Question

Transcribed Image Text:2) A survey was conducted to determine how people feel about the quality of programming available on
television. Respondents were asked to rate the overall quality from 0 (no quality at all) to 100 (extremely
good quality). The stem-and-leaf display of the data is shown below.
Stem|Leaf
33 6
40 3 47 899 9
50 1123 4 5
6125 6 6
70 6
8
What percentage of the respondents rated overall television quality as very good (regarded as ratings of 80
and above)?
A) 1%
В) 4%
C) 12%
D) 3%
Expert Solution
Step 1
Given Information:
The stem-and-leaf display of the data representing the overall quality ratings from 0 (no quality at all) to 100 (extremely good quality) is given below:
To find the percentage of the respondents rated overall television quality as very good (ratings 80 and above):
Probability of an event is given by the formula:

Trending now
This is a popular solution!

Step by step
Solved in 2 steps with 1 images

Knowledge Booster


Learn more about
Need a deep-dive on the concept behind this application? Look no further. Learn more about this topic, statistics and related others by exploring similar questions and additional content below.Recommended textbooks for you
MATLAB: An Introduction with Applications
Statistics
ISBN:
9781119256830
Author:
Amos Gilat
Publisher:
John Wiley & Sons Inc

Probability and Statistics for Engineering and th…
Statistics
ISBN:
9781305251809
Author:
Jay L. Devore
Publisher:
Cengage Learning

Statistics for The Behavioral Sciences (MindTap C…
Statistics
ISBN:
9781305504912
Author:
Frederick J Gravetter, Larry B. Wallnau
Publisher:
Cengage Learning
MATLAB: An Introduction with Applications
Statistics
ISBN:
9781119256830
Author:
Amos Gilat
Publisher:
John Wiley & Sons Inc
Probability and Statistics for Engineering and th…
Statistics
ISBN:
9781305251809
Author:
Jay L. Devore
Publisher:
Cengage Learning
Statistics for The Behavioral Sciences (MindTap C…
Statistics
ISBN:
9781305504912
Author:
Frederick J Gravetter, Larry B. Wallnau
Publisher:
Cengage Learning

Elementary Statistics: Picturing the World (7th E…
Statistics
ISBN:
9780134683416
Author:
Ron Larson, Betsy Farber
Publisher:
PEARSON

The Basic Practice of Statistics
Statistics
ISBN:
9781319042578
Author:
David S. Moore, William I. Notz, Michael A. Fligner
Publisher:
W. H. Freeman

Introduction to the Practice of Statistics
Statistics
ISBN:
9781319013387
Author:
David S. Moore, George P. McCabe, Bruce A. Craig
Publisher:
W. H. Freeman