13.1 64.2 What is the correlation coefficient for this data set? To find the p-value for a correlation coefficient, you n
Inverse Normal Distribution
The method used for finding the corresponding z-critical value in a normal distribution using the known probability is said to be an inverse normal distribution. The inverse normal distribution is a continuous probability distribution with a family of two parameters.
Mean, Median, Mode
It is a descriptive summary of a data set. It can be defined by using some of the measures. The central tendencies do not provide information regarding individual data from the dataset. However, they give a summary of the data set. The central tendency or measure of central tendency is a central or typical value for a probability distribution.
Z-Scores
A z-score is a unit of measurement used in statistics to describe the position of a raw score in terms of its distance from the mean, measured with reference to standard deviation from the mean. Z-scores are useful in statistics because they allow comparison between two scores that belong to different normal distributions.
![You wish to determine if there is a linear correlation between the two variables at a significance level of
a = 0.005. You have the following bivariate data set.
28.9
69.7
60.2
56.1
56.8
84.8
38.8
27.7
48.9
98.9
78.3
61.5
54.5
71.7
50.1
75.2
34.4
93.2
13.1
64.2
What is the correlation coefficient for this data set?
To find the p-value for a correlation coefficient, you need to convert to a t-score:
2(n – 2)
t =
This t-score is from a t-distribution with n-2 degrees of freedom.
What is the p-value for this correlation coefficient?
p-value =
Your final conclusion is that...
O There is sufficient sample evidence to support the claim that there is a statistically significant
correlation between the two variables.
O There is insufficient sample evidence to support the claim the there is a correlation between the two
variables.
Note: In your calculations, round both r and t to 3 decimal places in ALL calculations.](/v2/_next/image?url=https%3A%2F%2Fcontent.bartleby.com%2Fqna-images%2Fquestion%2Fb9849c3b-f0ff-47eb-829a-2c91d3fc6b02%2F728f9e0a-de9a-418f-a78f-e2ab2d9a02a2%2Fhiq5mal_processed.png&w=3840&q=75)
![](/static/compass_v2/shared-icons/check-mark.png)
The data for two variables x and y is given in the following table,
x | y |
28.9 | 69.7 |
60.2 | 56.1 |
56.8 | 84.8 |
38.8 | 98.9 |
27.7 | 78.3 |
48.9 | 61.5 |
54.5 | 71.7 |
50.1 | 75.2 |
34.4 | 93.2 |
13.1 | 64.2 |
It is required to test the significance of correlation.
The given level of significance is 0.005.
First calculating the correlation coefficient
It can be calculated using MS-Excel.
Steps for calculating using MS-Excel are as follows
- Enter the data in MS-Excel
- Click on the Data toolbar >> Select the Data Analysis >>Correlation.
- Select the entire data as an input range. (Check labels if included)
The output will be
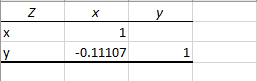
From the above output the correlation coefficient (r) = -0.11107
Rounding to three decimal
r = -0.111
The null and alternative hypothesis is
H0 : = 0
H1 :
Where is the population correlation coefficient.
The formula for test statistic is
= 0.3309673
Rounding to three decimal
t =0.331
The degree of freedom for the test is df = n -2 = 8
Step by step
Solved in 5 steps with 1 images
![Blurred answer](/static/compass_v2/solution-images/blurred-answer.jpg)
![MATLAB: An Introduction with Applications](https://www.bartleby.com/isbn_cover_images/9781119256830/9781119256830_smallCoverImage.gif)
![Probability and Statistics for Engineering and th…](https://www.bartleby.com/isbn_cover_images/9781305251809/9781305251809_smallCoverImage.gif)
![Statistics for The Behavioral Sciences (MindTap C…](https://www.bartleby.com/isbn_cover_images/9781305504912/9781305504912_smallCoverImage.gif)
![Elementary Statistics: Picturing the World (7th E…](https://www.bartleby.com/isbn_cover_images/9780134683416/9780134683416_smallCoverImage.gif)
![The Basic Practice of Statistics](https://www.bartleby.com/isbn_cover_images/9781319042578/9781319042578_smallCoverImage.gif)
![Introduction to the Practice of Statistics](https://www.bartleby.com/isbn_cover_images/9781319013387/9781319013387_smallCoverImage.gif)