Jse the Women's Earnings scatterplot below to answer the questions. Women's Earnings as a Percentage of Men's Earnings 90 80 70 60 50 y = 0.617x - 1156.3 R² = 0.9302 40 30 20 10 1979 1984 1989 1994 1999 2004 2009 Year s there a strong, moderate or no linear correlation between the dependent and independent variable? [Select] Percentage


Correlation
Correlation defines a relationship between two independent variables. It tells the degree to which variables move in relation to each other. When two sets of data are related to each other, there is a correlation between them.
Linear Correlation
A correlation is used to determine the relationships between numerical and categorical variables. In other words, it is an indicator of how things are connected to one another. The correlation analysis is the study of how variables are related.
Regression Analysis
Regression analysis is a statistical method in which it estimates the relationship between a dependent variable and one or more independent variable. In simple terms dependent variable is called as outcome variable and independent variable is called as predictors. Regression analysis is one of the methods to find the trends in data. The independent variable used in Regression analysis is named Predictor variable. It offers data of an associated dependent variable regarding a particular outcome.
![Jse the Women's Earnings scatterplot below to answer the questions.
Women's Earnings as a Percentage of Men's
Earnings
90
80
70
60
50
y = 0.617x - 1156.3
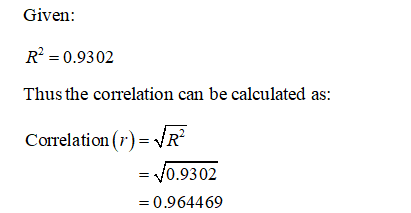
R² = 0.9302
40
30
20
10
1979
1984
1989
1994
1999
2004
2009
Year
s there a strong, moderate or no linear correlation between the dependent and independent variable? [Select]
Percentage](/v2/_next/image?url=https%3A%2F%2Fcontent.bartleby.com%2Fqna-images%2Fquestion%2Fb212f3e9-eb5f-482a-989a-b60c4c167cfd%2F79bbe203-99a0-4de7-b512-c14a6e788000%2F3v9hvi.png&w=3840&q=75)

Step by step
Solved in 2 steps with 1 images


