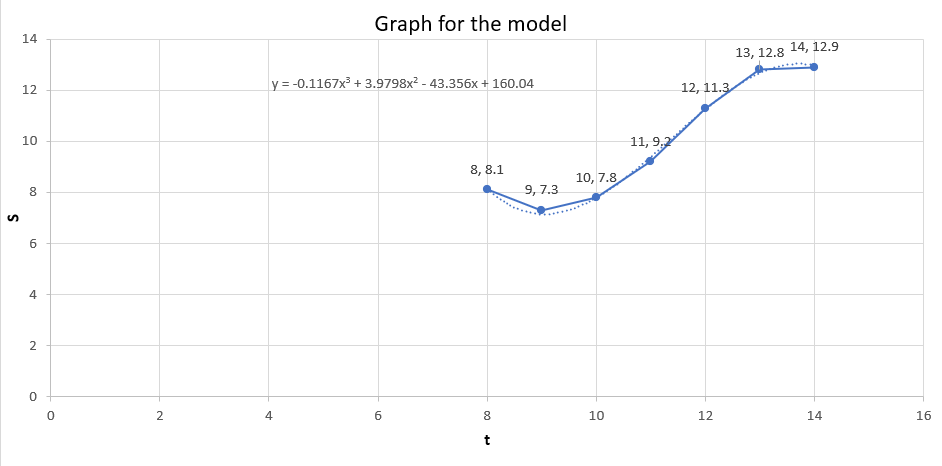
10 11 12 13 t 8 9. 14 S 8.1 7.3 7.8 9.2 11.3 12.8 12.9


Correlation
Correlation defines a relationship between two independent variables. It tells the degree to which variables move in relation to each other. When two sets of data are related to each other, there is a correlation between them.
Linear Correlation
A correlation is used to determine the relationships between numerical and categorical variables. In other words, it is an indicator of how things are connected to one another. The correlation analysis is the study of how variables are related.
Regression Analysis
Regression analysis is a statistical method in which it estimates the relationship between a dependent variable and one or more independent variable. In simple terms dependent variable is called as outcome variable and independent variable is called as predictors. Regression analysis is one of the methods to find the trends in data. The independent variable used in Regression analysis is named Predictor variable. It offers data of an associated dependent variable regarding a particular outcome.
The manager of a store recorded the annual sales S (in thousands of dollars) of a product over a period of 7 years, as shown in the table, where t is the time in years, with t = 8 corresponding to 2008.(a) Use the regression capabilities of a graphing utility to find a model of the form S = at3 + bt2 + ct + d for the data. (b) Use a graphing utility to plot the data and graph the model. (c) Use calculus and the model to find the time t when sales were increasing at the greatest rate. (d) Do you think the model would be accurate for predicting future sales? Explain

Given Information:
The data for the annual sales and the time is given. The value of time for 2008 is 8.
(a)
The regression model is;
The normal equations will be,
The table given below shows the values of .
| S.No. | t | S | ||||||||
| 1 | 8 | 8.1 | 64 | 512 | 4096 | 32768 | 262144 | 64.8 | 518.4 | 4147.2 |
| 2 | 9 | 7.3 | 81 | 729 | 6561 | 59049 | 531441 | 65.7 | 591.3 | 5321.7 |
| 3 | 10 | 7.8 | 100 | 1000 | 10000 | 100000 | 1000000 | 78 | 780 | 7800 |
| 4 | 11 | 9.2 | 121 | 1331 | 14641 | 161051 | 1771561 | 101.2 | 1113.2 | 12245.2 |
| 5 | 12 | 11.3 | 144 | 1728 | 20736 | 248832 | 2985984 | 135.6 | 1627.2 | 19526.4 |
| 6 | 13 | 12.8 | 169 | 2197 | 28561 | 371293 | 4826809 | 166.4 | 2163.2 | 28121.6 |
| 7 | 14 | 12.9 | 196 | 2744 | 38416 | 537824 | 7529536 | 180.6 | 2528.4 | 35397.6 |
| Total |
Putting the values in the above equations.
Solving the above equations, the value of is;
Thus, the regression model is, .
(b)
Using excel, the graph of the data and the model is given as,

Trending now
This is a popular solution!

Step by step
Solved in 5 steps with 1 images


