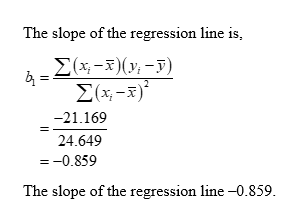
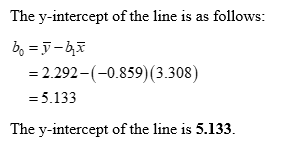
1. We want to look at the relationship between the estimated cost (y) and the age of the vehicle (x). Assume that we have calculated these values from the sample * = 3.308, ỹ = 2.292 %3D (r; – )(y – ) = -21.169, (x; – x)² = 24.649 %3D Xi Xi %3D
Q: I need help with part b, to plot the studentized residuals against x1,x2,and x3. Choose the correct…
A: ANS )The diagrams are attached below for x1, x2 and x3
Q: Emissions of sulfur dioxide by industry set off chemical changes in the atmosphere that result in…
A: Given Mean=5.43 Standard deviations=0.54
Q: (2) Suppose a purpose of study is to find a relationship between the "years of education" and…
A: Consider the given information in which the variable x is the year of education and y is the…
Q: Suppose you are interested in uncovering the relationship between snowfall (in inches) in the month…
A: Given that Using excel regression Option 2 is the answer
Q: f(-4) = 3, f'(-4) = 3, g(-4) = 4, gʻ(-4) = 8, calculate the following: (fg)'(-4) = (f/g)'(-4) =…
A:
Q: Calculate the times (in months) needed for the degradation of ascorbic acid by 50% in orange juice…
A: The standard equation for first order kinetic reaction is given by lnC=lnC0-kt. In this equation k…
Q: None
A: Let's break it down step by step.(a) Create pt=ln(Pt)),(dt=ln(Dt)),(et=ln(Et), and plot them…
Q: From HW 8.2 , #19 Find the value of each variable. 19. 45 60 y y=D 6/3
A: Detailed solution is given below.
Q: 5.1. A study was conducted to ascertain the effectiveness of a treatment of diseased plants. A…
A: From the given information, the effects of the treatment (Y) represents the dependent variable. The…
Q: Differentiate the function. y= (3x* -x+2) (-x² +9) %3D
A: We have to differentiate of given function.
Q: If f(3) = 5, f'(3) = 5, g(3) = 1 and gʻ(3) = 1, then z f(z) g(z) dr
A:
Q: midterm OThe grade of aclass af 9 student; report (x) and on the fnal examination (9) ane as Follows…
A: The linear regression technique uses a dataset to determine a linear function, such that the data…
Q: observed in the reservoir over the course of an hour while technicians needed. time (min) 0 10 30…
A: Q4. Given,
Q: 5.4. To establish whether RATE is indeed needed to predict the effectiveness of a treatment, a…
A: Given is the summary of logistic regression to predict the effectiveness of the treatment (Y) from…
Q: 1. (a) What is related rates problems? Write down the necessity of related rates problems in…
A: The problems where two quantities are related to each other which can be used to find the rate at…
Q: ŷ 2.8156 +0.967rating - 0.0084size + 17.538type The estimated average tuition fees a student would…
A: To calculate the estimated average tuition fees, plug in the given values into the equation: ŷ =…
Q: A biologist looked at the relationship between number of seeds a plant produces and the percent of…
A: Hey, since there are multiple subparts posted, we will answer first three subparts. If you want any…
Q: The efficiency for a steel specimen immersed in a phosphating tank is the weight of the phosphate…
A: The question is about regressionGiven :To find :a ) Eq. of estimated reg. equationb ) pt. estimate…
Q: 10.5 3.5 10.5 | f(x) dx = 9, f(x) dx = 11, and | f(x) dæ = 9. Let %3D %3D Find the following: (a)…
A:
Q: Please explain how the 32 was caculated in the problem? I had the same question and got it wrong
A: as we can see is solution No. of coins tossed = 5 P(H)=12 and P(T)=12
Q: The efficiency for a steel specimen immersed in a phosphating tank is the weight of the phosphate…
A: Temp.Ratio1730.881751.371761.41770.971771.091780.9817911801.71831.471831.71831.671832.151832.111840.…
Q: The efficiency for a steel specimen immersed in a phosphating tank is the weight of the phosphate…
A: a) we need to find regression equation for the given data. Given X is the Temperature and Y-…
Q: 19. Compute for the Crude Death Rate (based on the picture) A. 39.43 B. 42 C. 29.53 D. 37. 68
A: The formula to find the crude death rate is, CDR=Number of deaths during a yearmid year…
Q: In a certain dynamic measurement application the input(x) – output(y) relationship is given by…
A: Given,y=1+1+xe-x∂yy×100=±2% at x=3.8∂yy=0.02y=1+(1+3.8)e-3.8y=1.10737
Q: ít was 6 (bi-ha)=LL(h,0ha)= HAan 1 (h)=
A:
Q: 9. Loss of calcium is a serious problem for older women. At the beginning of a study on the…
A: 9) Given data in ascending order,0.72, 0.79, 0.80, 0.85, 0.88, 0.90, 0.91, 0.94, 1.00, 1.06,…
Q: Find f. f'(x) = 20x³ + 1 x > 0, f(1) = -2
A:
Q: A study was conducted of 90 adult male patients following a new treatment for congestive heart…
A: Introduction: It is required to answer the given questions regarding the power curve in a hypothesis…
Q: Following are age and price data for 8 randomly selected ambulances between 1 and 6 years old. Here,…
A: X : { 6,1,6,2,6,2,4,5 } Y : { 260,420,255,370,280,350,315,300 } N=8 ΣX = 32 ΣY = 2550 ΣXY = 9390…
Q: For the period 1970-1991 for the United States the following two rival consumption models were…
A: a) The model with the lowest AIC value being considered the ‘best’. From the provided information,…
Q: and standard deviation 1. Let x be a sequence from -4 to 4 in increments of 0.1. Estimate the bias…
A: a 1 b 1.5 -4 -3.9 -3.8 -3.7 -3.6 -3.5 -3.4 -3.3 -3.2 -3.1 -3 -2.9…
Q: Suppose you are interested in uncovering the relationship between snowfall (in inches) in the month…
A: The given paired observations of measured snowfall flow rate in the months of December and April of…
Q: Consider the following simple relationship between aggregate savings St and aggregate income Yt: St=…
A: The test statistic for testing autocorrelation is DW= 0.70
Q: Year 2006 2007 2008 2009 2010 2011 2012 2013 2014 2015 2016 2017 Total = JALSH (Y) 0.41 0.19 -0.23…
A: The linear regression model is given by, Y= B0+B1*X Where Y is variable Jalsh and X is variable…
Q: ...
A: Solution R squared is coefficient of determination
Q: When purifying drinking water you can use a so-called membrane filtration. In an experiment one…
A: Since you have posted a question with multiple sub-parts, we will solve first three sub- parts for…
Q: Q1: The data points below are related to a chemi-thermo-mechanical pulp from mixed density…
A: As we are authorized to answer only 3 subparts for each question and that you haven't specified…
1.
Trending now
This is a popular solution!
Step by step
Solved in 3 steps with 4 images
- Please answer number 1Please answer from question 4 to last questionMy answers from question 1 to 3 are at the end Sarah wants to estimate the relationship between individual earnings in the labour market (earn) and years of education achieved (educ). She collects data from a sample of 122 individuals on their monthly salaries (Y), measured in rands, and education levels (X), measured in years of education.Based on these data, she derives the following estimates: ∑XY=41421943.8∑X2=15472∑X=1242∑Y=3401031 Question 1 The value for the slope parameter is ? Question 2 .The value for the intercept parameter is ? Question 3 If se(β2)=212.4477226, construct a 99% confidence interval for the parameter. Pr( ?. ≤β2≤ . )=99% Question 4 If se(β1)=2392.463897, construct a 99% confidence interval for the parameter. Pr( ? ≤β1≤ ?. )=99% Question 5 Under a simple interpretation of the above results, if an individual wishes to earn a monthly salary of R50 000, how many years…Tax Usage Y 26.26666.04 16.32777.73 19.49921.97 29.29484.77 22.73885.77 12.54597.13 The above given table shows the tax and gas fuel use. Find Y' when x = 14.9 =?
- Laetisaric acid is a compound that holds promise for control of fungus diseases in crop plants. The accompanying data show the results of growing the fungus Pythium (y) in various concentrations of laetisaric acid (x). Laetisaric acid concentration (uG/mL) Fungus growth (mm) 0. 33.3 31.0 29.8 27.8 6. 28.0 6. 29.0 10 25.5 10 23.8 20 18.3 20 15.5 30 11.7 30 10.0 Mean 11.500 23.642 Standard deviation 10.884 7.8471 T =-0.98754 %3D a. State the linear regression equation, and with a 0.01 level of significance, predict the amount (in mm) of fungus growth when 25 uG/mL laetisaric acid is applied. Assume the pairs of data follow a bivariate normal distribution and that the scatterplot shows no evidence of a non-linear relationship in the data. b. Determine the percentage of the variation in fungus growth that is explained by the linear relationship between laetisaric acid concentration and fungus growth. Attack EilWater is poured into a large, cone-shaped cistern. The volume of water, measured in cm, is reported at Which of the following would linearize the data for volume and time? different time intervals, measured in seconds. The scatterplot of volume versus time showed a curved Seconds, cm3 O In(Seconds), cm3 Seconds, In(cm') pattern. O In(Seconds), In(cm³)This is a chart with Temperature Anomalies and Time, what does it indicate about global warming if y = 0.0007x - 0.5429R² = 0.1793
- 4. Draw graphs of the % change in moment of inertia against the change in dimension on the X-X axis and Y-Y axis Discuss and compare your results from the two samples. Section / Bar h = 25mm W = 12mm 7 bh² Section 2 (Pipe) Thiz hness= Diameter = 36" उसने 4x=54² 25m 12mm -36mmThe following table gives the regression results of consumption behaviour between female and male. Consumption (C), in RM Model 1 Model 2 Constant 0.7515 0.6587 (0.024) (0.037) Y 0.8603 0.5442 (0.0301) (0.2881) Gen 0.2001 (0.0004) Y*Gen 0.3105 (0.0076) Adjusted R 0.78 0.78 No. of Observations 47 47 Note: Y=income (RM) Gen= Gender ( It is equal to 1 if person is female; 0 is for male) Figures in the parentheses are p- values a) Identify which are the qualitative, quantitative and interaction variable. Refer to Model 1: b) Write the regression equations for female and male. Draw the regression lines for female and male on the same diagram. What can you c) say? d) Interpret all the estimated slope coefficients. e) Conduct an appropriate test to determine whether variable gender is statistically significant at 5%. Should this variable be dropped from this regression model.Complete the missing information for this regression model (df= 23). Y' 1.0 X, .50 X, 25.1 1.2 X, + + (2.1) (1.5) (1.3) (.06) standard errors () () () (11.9) () t ratios () () Significant at .05?