1. For a and b, conduct every step of the Hypothesis testing process (1-5). The distribution of SAT scores is normal with M = 500, with a standard deviation alpha = 100. Mable believes that she scored significantly higher than average, at x = 643. Did Mable scores significantly higher than the average SAT score? A sample of n = 30 adults is taken from the above population and their average SAT score is measured to be M = 507. Does this sample differ from the population?
1. For a and b, conduct every step of the Hypothesis testing process (1-5).
-
The distribution of SAT scores is normal with M = 500, with a standard deviation alpha = 100. Mable believes that she scored significantly higher than average, at x = 643. Did Mable scores significantly higher than the average SAT score?
-
A sample of n = 30 adults is taken from the above population and their average SAT score is measured to be M = 507. Does this sample differ from the population?
1. The null and alternative hypothesis is given by;

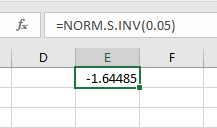
Hence the critical value is;
z0.05 = 1.645 [Since Normal Distribution is symmetric]
Here;
z < z0.05
We accept the null hypothesis. Hence Mable did not score significantly higher than the average SAT score.
Trending now
This is a popular solution!
Step by step
Solved in 2 steps with 2 images


