1. Consider the Continuous Distribution Given by its Probability Density Function f(x) = x € [10, 30] [10,30] A. Confirm that f(x) is indeed a Probability Density Function. Thus you have to show that the following two conditions are true 1. f(x) > 0 II. The Area under its graph is equal to 1. Hint: Its a graph will be a Triangle x < 10 0 B. Confirm that F(x) = (x − 10)² ÷ 400 10 ≤ x ≤ 30 is the 1 x > 30 Cumulative Distribution Function (CDF) of this probability density function. Hint: Area under a curve is gonna be a triangle, compute its area at a given point. 2-10 200 0
1. Consider the Continuous Distribution Given by its Probability Density Function f(x) = x € [10, 30] [10,30] A. Confirm that f(x) is indeed a Probability Density Function. Thus you have to show that the following two conditions are true 1. f(x) > 0 II. The Area under its graph is equal to 1. Hint: Its a graph will be a Triangle x < 10 0 B. Confirm that F(x) = (x − 10)² ÷ 400 10 ≤ x ≤ 30 is the 1 x > 30 Cumulative Distribution Function (CDF) of this probability density function. Hint: Area under a curve is gonna be a triangle, compute its area at a given point. 2-10 200 0

MATLAB: An Introduction with Applications
6th Edition
ISBN:9781119256830
Author:Amos Gilat
Publisher:Amos Gilat
Chapter1: Starting With Matlab
Section: Chapter Questions
Problem 1P

Related questions
Question
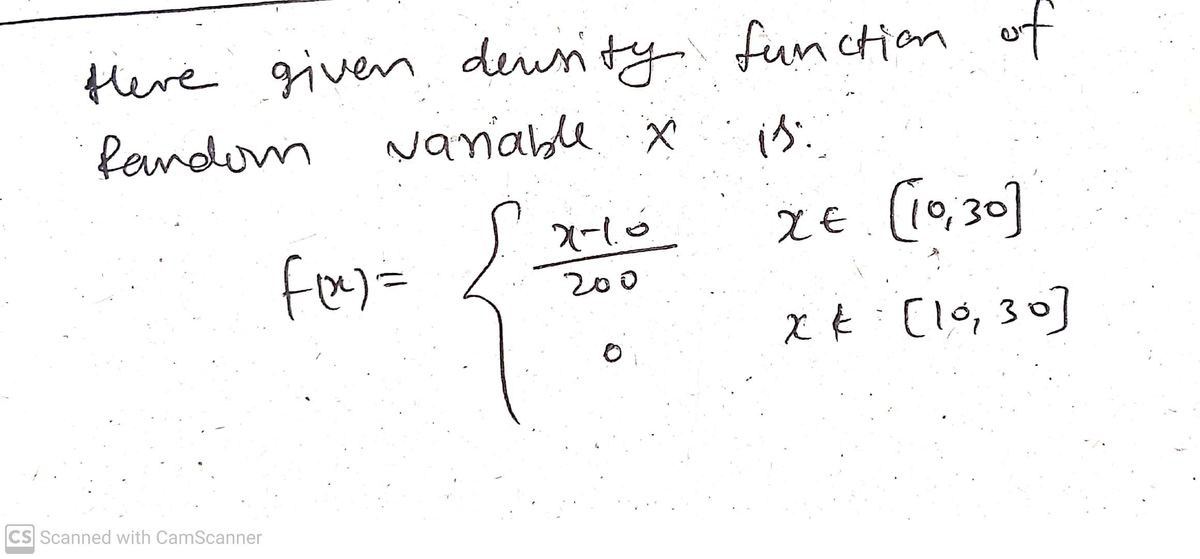
![# Continuous Distribution and Probability Density Function
## 1. Consider the Continuous Distribution Given by its Probability Density Function
\[ f(x) =
\begin{cases}
\frac{x-10}{200} & x \in [10, 30] \\
0 & x \notin [10, 30]
\end{cases}
\]
### A. Confirm that \( f(x) \) is indeed a Probability Density Function.
To do this, you must demonstrate that the following two conditions are true:
1. \( f(x) \geq 0 \)
2. The area under its graph is equal to 1.
- **Hint:** Its graph will be a triangle.
### B. Confirm that
\[ F(x) =
\begin{cases}
0 & x < 10 \\
\frac{(x-10)^2}{400} & 10 \leq x \leq 30 \\
1 & x > 30
\end{cases}
\]
is the Cumulative Distribution Function (CDF) of this probability density function.
- **Hint:** The area under a curve is going to be a triangle, compute its area at a given point.
### Explanation of the Graph:
The function \( f(x) \) is defined as a piecewise function with a linear segment between \( x = 10 \) and \( x = 30 \), forming a triangle when graphed. The base of this triangle is along the x-axis from \( 10 \) to \( 30 \), while the height is determined by the slope \( \frac{1}{200} \). This ensures the total area under the curve is 1, satisfying the requirement for a probability density function.](/v2/_next/image?url=https%3A%2F%2Fcontent.bartleby.com%2Fqna-images%2Fquestion%2F15077d0c-06b0-46d9-ae2e-319ac77cceb5%2Fc160c328-245f-4de6-940d-d822431628cf%2Fxhwv36e_processed.jpeg&w=3840&q=75)
Transcribed Image Text:# Continuous Distribution and Probability Density Function
## 1. Consider the Continuous Distribution Given by its Probability Density Function
\[ f(x) =
\begin{cases}
\frac{x-10}{200} & x \in [10, 30] \\
0 & x \notin [10, 30]
\end{cases}
\]
### A. Confirm that \( f(x) \) is indeed a Probability Density Function.
To do this, you must demonstrate that the following two conditions are true:
1. \( f(x) \geq 0 \)
2. The area under its graph is equal to 1.
- **Hint:** Its graph will be a triangle.
### B. Confirm that
\[ F(x) =
\begin{cases}
0 & x < 10 \\
\frac{(x-10)^2}{400} & 10 \leq x \leq 30 \\
1 & x > 30
\end{cases}
\]
is the Cumulative Distribution Function (CDF) of this probability density function.
- **Hint:** The area under a curve is going to be a triangle, compute its area at a given point.
### Explanation of the Graph:
The function \( f(x) \) is defined as a piecewise function with a linear segment between \( x = 10 \) and \( x = 30 \), forming a triangle when graphed. The base of this triangle is along the x-axis from \( 10 \) to \( 30 \), while the height is determined by the slope \( \frac{1}{200} \). This ensures the total area under the curve is 1, satisfying the requirement for a probability density function.
Expert Solution
Step 1

Step by step
Solved in 4 steps with 4 images

Recommended textbooks for you
MATLAB: An Introduction with Applications
Statistics
ISBN:
9781119256830
Author:
Amos Gilat
Publisher:
John Wiley & Sons Inc

Probability and Statistics for Engineering and th…
Statistics
ISBN:
9781305251809
Author:
Jay L. Devore
Publisher:
Cengage Learning

Statistics for The Behavioral Sciences (MindTap C…
Statistics
ISBN:
9781305504912
Author:
Frederick J Gravetter, Larry B. Wallnau
Publisher:
Cengage Learning
MATLAB: An Introduction with Applications
Statistics
ISBN:
9781119256830
Author:
Amos Gilat
Publisher:
John Wiley & Sons Inc
Probability and Statistics for Engineering and th…
Statistics
ISBN:
9781305251809
Author:
Jay L. Devore
Publisher:
Cengage Learning
Statistics for The Behavioral Sciences (MindTap C…
Statistics
ISBN:
9781305504912
Author:
Frederick J Gravetter, Larry B. Wallnau
Publisher:
Cengage Learning

Elementary Statistics: Picturing the World (7th E…
Statistics
ISBN:
9780134683416
Author:
Ron Larson, Betsy Farber
Publisher:
PEARSON

The Basic Practice of Statistics
Statistics
ISBN:
9781319042578
Author:
David S. Moore, William I. Notz, Michael A. Fligner
Publisher:
W. H. Freeman

Introduction to the Practice of Statistics
Statistics
ISBN:
9781319013387
Author:
David S. Moore, George P. McCabe, Bruce A. Craig
Publisher:
W. H. Freeman