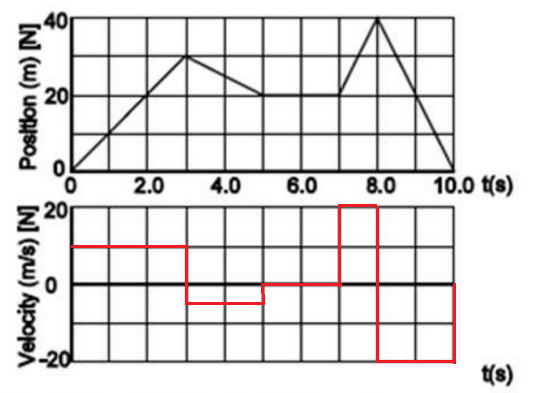
1. An object moves as shown on the d-t graph. 40 20 2.0 4.0 6.0 8.0 10.0 t(s) 20 t(s) (a) Sketch the graph of velocity vs time. (b) Determine the object's: O position at 7.0 s m[N] 2 total distance O total displacement O average speed For entire trip * average velocity for entire trip m/s m/s[N] Velocity (m/s) [N] Position (m) [N]
1. An object moves as shown on the d-t graph. 40 20 2.0 4.0 6.0 8.0 10.0 t(s) 20 t(s) (a) Sketch the graph of velocity vs time. (b) Determine the object's: O position at 7.0 s m[N] 2 total distance O total displacement O average speed For entire trip * average velocity for entire trip m/s m/s[N] Velocity (m/s) [N] Position (m) [N]

College Physics
11th Edition
ISBN:9781305952300
Author:Raymond A. Serway, Chris Vuille
Publisher:Raymond A. Serway, Chris Vuille
Chapter1: Units, Trigonometry. And Vectors
Section: Chapter Questions
Problem 1CQ: Estimate the order of magnitude of the length, in meters, of each of the following; (a) a mouse, (b)...

Related questions
Question
PLS HELP WITH THIS QUESTION.
![1. An object moves as shown on the d-t graph.
40
20
2.0
4.0
6.0
8.0
10.0 t(s)
t(s)
(a) Sketch the graph of velocity vs time.
(b) Determine the object's:
O position at 7.0 s
m[N]
2 total distance
O total displacement
O average speed
For entire trip
average velocity
for entire trip
m/s
m/s[N]
Velocity (m/s) [N]
Position (m) N]](/v2/_next/image?url=https%3A%2F%2Fcontent.bartleby.com%2Fqna-images%2Fquestion%2F38392922-e79b-4467-bdea-1e44ef4a2e5d%2F289e5fd5-c5c8-4915-9aa0-81c133bd5328%2Fr63ru5o_processed.png&w=3840&q=75)
Transcribed Image Text:1. An object moves as shown on the d-t graph.
40
20
2.0
4.0
6.0
8.0
10.0 t(s)
t(s)
(a) Sketch the graph of velocity vs time.
(b) Determine the object's:
O position at 7.0 s
m[N]
2 total distance
O total displacement
O average speed
For entire trip
average velocity
for entire trip
m/s
m/s[N]
Velocity (m/s) [N]
Position (m) N]
Expert Solution
Step 1
a)
Velocity is defined as the time rate of change of displacement:
i.e. slope of the position time graph is velocity.
since the position time graph is a set of straight lines so the slope is constant for the interval of every line in position time graph,
Slope = so the graph will be

Step by step
Solved in 2 steps with 1 images

Recommended textbooks for you
College Physics
Physics
ISBN:
9781305952300
Author:
Raymond A. Serway, Chris Vuille
Publisher:
Cengage Learning

University Physics (14th Edition)
Physics
ISBN:
9780133969290
Author:
Hugh D. Young, Roger A. Freedman
Publisher:
PEARSON

Introduction To Quantum Mechanics
Physics
ISBN:
9781107189638
Author:
Griffiths, David J., Schroeter, Darrell F.
Publisher:
Cambridge University Press
College Physics
Physics
ISBN:
9781305952300
Author:
Raymond A. Serway, Chris Vuille
Publisher:
Cengage Learning
University Physics (14th Edition)
Physics
ISBN:
9780133969290
Author:
Hugh D. Young, Roger A. Freedman
Publisher:
PEARSON
Introduction To Quantum Mechanics
Physics
ISBN:
9781107189638
Author:
Griffiths, David J., Schroeter, Darrell F.
Publisher:
Cambridge University Press

Physics for Scientists and Engineers
Physics
ISBN:
9781337553278
Author:
Raymond A. Serway, John W. Jewett
Publisher:
Cengage Learning

Lecture- Tutorials for Introductory Astronomy
Physics
ISBN:
9780321820464
Author:
Edward E. Prather, Tim P. Slater, Jeff P. Adams, Gina Brissenden
Publisher:
Addison-Wesley

College Physics: A Strategic Approach (4th Editio…
Physics
ISBN:
9780134609034
Author:
Randall D. Knight (Professor Emeritus), Brian Jones, Stuart Field
Publisher:
PEARSON