1) Using the above data table, find and report the following probabilities: The probability that one randomly selected patient is experiencing High COVID-19 severity giver they are a Never Smoker i.e., P(High | Never). a. b. The probability that one randomly selected patient is experiencing High COVID-19 severity giver they are an "Ever" Smoker meaning that they are a Current or Former Smoker, i.e., P(High | Current or Former).
Contingency Table
A contingency table can be defined as the visual representation of the relationship between two or more categorical variables that can be evaluated and registered. It is a categorical version of the scatterplot, which is used to investigate the linear relationship between two variables. A contingency table is indeed a type of frequency distribution table that displays two variables at the same time.
Binomial Distribution
Binomial is an algebraic expression of the sum or the difference of two terms. Before knowing about binomial distribution, we must know about the binomial theorem.
![The recent pandemic has dramatically changed many of our lives in so many ways. From a public health
perspective, there has been great interest in understanding the factors that might contribute to or directly
impact the severity of CoVID-19.
A researcher wishes to evaluate the severity of COVID-19 ("low" i.e., asymptomatic/mild or "high" i.e.,
severe/critical) for patients with different self-described smoking histories (current, former, or never
smoker). In order to assess the possible relationship between CoVID-19 severity and patient smoking
history, data for 354 COVID-19 patients from a local hospital were collected and are provided below.
COVID-19 Severity
Smoking History
Low
High
Current
87
15
Former
43
9.
Never
136
64
1 | Page
S. Robinson](/v2/_next/image?url=https%3A%2F%2Fcontent.bartleby.com%2Fqna-images%2Fquestion%2Ffcd2e8a9-5238-4470-b01a-2b8e10a1793f%2Fbbdc250b-b687-4eb3-92c1-0f3910beb7cf%2Folsun7e_processed.jpeg&w=3840&q=75)
![1) Using the above data table, find and report the following probabilities:
The probability that one randomly selected patient is experiencing High COVID-19 severity given
they are a Never Smoker i.e., P(High | Never).
a.
b. The probability that one randomly selected patient is experiencing High COVID-19 severity given
they are an "Ever" Smoker meaning that they are a Current or Former Smoker, i.e.,
P(High | Current or Former).
2) Using StatCrunch* and the available data, construct a 99% Confidence Interval for the proportion of
all patients experiencing High COVID-19 severity if they are a Never Smoker.
Let P(High | Never) = PNever
a. Report the confidence interval using proper notation.
b. In one to two complete sentences, state an interpretation for this confidence interval.
3) Using StatCrunch* and the available data, construct a 99% Confidence Interval for the proportion of
all patients experiencing High COVID-19 severity if they are an "Ever" Smoker (i.e., they are a
Current or Former Smoker.
Let P(High | Current or Former) = PEver
%3D
a. Report the confidence interval using proper notation.
b. In one to two complete sentences, state an interpretation for this confidence interval.
lata: "Is there an advantage to being a](/v2/_next/image?url=https%3A%2F%2Fcontent.bartleby.com%2Fqna-images%2Fquestion%2Ffcd2e8a9-5238-4470-b01a-2b8e10a1793f%2Fbbdc250b-b687-4eb3-92c1-0f3910beb7cf%2F6l7ui5c_processed.jpeg&w=3840&q=75)
![](/static/compass_v2/shared-icons/check-mark.png)
“Since you have asked multiple question, we will solve the first question for you. If you want any specific question to be solved then please specify the question number or post only that question.”
From the given information, total number of CoVID-19 patients n (S) = 354.
The given table is,
CoVID-19 Security |
|||
Smoking History |
Low |
High |
Total |
Current |
87 |
15 |
102 |
Former |
43 |
9 |
52 |
Never |
136 |
64 |
200 |
Total |
266 |
88 |
354 |
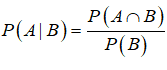
Use the following formula to compute the given conditional probability:
Trending now
This is a popular solution!
Step by step
Solved in 3 steps with 5 images
![Blurred answer](/static/compass_v2/solution-images/blurred-answer.jpg)
![MATLAB: An Introduction with Applications](https://www.bartleby.com/isbn_cover_images/9781119256830/9781119256830_smallCoverImage.gif)
![Probability and Statistics for Engineering and th…](https://www.bartleby.com/isbn_cover_images/9781305251809/9781305251809_smallCoverImage.gif)
![Statistics for The Behavioral Sciences (MindTap C…](https://www.bartleby.com/isbn_cover_images/9781305504912/9781305504912_smallCoverImage.gif)
![Elementary Statistics: Picturing the World (7th E…](https://www.bartleby.com/isbn_cover_images/9780134683416/9780134683416_smallCoverImage.gif)
![The Basic Practice of Statistics](https://www.bartleby.com/isbn_cover_images/9781319042578/9781319042578_smallCoverImage.gif)
![Introduction to the Practice of Statistics](https://www.bartleby.com/isbn_cover_images/9781319013387/9781319013387_smallCoverImage.gif)