1) analyze the data using pearson correlation coefficient (show the output of the analysis) 2) describe the obtained results 3) make a conclusion about whether your hypothesis was supported. hypothesis: Our hypothesis is if you watch less TV in a day, then you will sleep more hours per night.
Correlation
Correlation defines a relationship between two independent variables. It tells the degree to which variables move in relation to each other. When two sets of data are related to each other, there is a correlation between them.
Linear Correlation
A correlation is used to determine the relationships between numerical and categorical variables. In other words, it is an indicator of how things are connected to one another. The correlation analysis is the study of how variables are related.
Regression Analysis
Regression analysis is a statistical method in which it estimates the relationship between a dependent variable and one or more independent variable. In simple terms dependent variable is called as outcome variable and independent variable is called as predictors. Regression analysis is one of the methods to find the trends in data. The independent variable used in Regression analysis is named Predictor variable. It offers data of an associated dependent variable regarding a particular outcome.
1) analyze the data using pearson
2) describe the obtained results
3) make a conclusion about whether your hypothesis was supported.
hypothesis: Our hypothesis is if you watch less TV in a day, then you will sleep more hours per night.
![This table presents data on the following categories for 10 different subjects:
1. **Exercise**
2. **Junk Food Consumption**
3. **TV Watching Hours**
4. **Sleep Duration**
5. **Fruits and Vegetables Intake**
Each column represents a specific category, while each row corresponds to data from one subject.
- **Exercise**: Rated on a scale of 0 to 9, indicating the level of physical activity performed.
- **Junk Food**: Rated on a scale of 0 to 9, indicating the frequency of junk food consumption.
- **TV**: Rated on a scale of 0 to 5, indicating the number of hours spent watching TV.
- **Sleep**: Rated on a scale of 0 to 8, indicating the number of hours of sleep.
- **Fruits and Vegetables**: Rated on a scale of 0 to 7, indicating the intake frequency of fruits and vegetables.
The values in each cell denote the respective scores for each category per subject.
Here is a detailed breakdown:
- Subject 1:
- Exercise: 7
- Junk Food: 7
- TV: 5
- Sleep: 5
- Fruits and Vegetables: 4
- Subject 2:
- Exercise: 2
- Junk Food: 4
- TV: 4
- Sleep: 5
- Fruits and Vegetables: 2
- Subject 3:
- Exercise: 5
- Junk Food: 4
- TV: 3
- Sleep: 6
- Fruits and Vegetables: 3
- Subject 4:
- Exercise: 7
- Junk Food: 5
- TV: 0
- Sleep: 5
- Fruits and Vegetables: 7
- Subject 5:
- Exercise: 9
- Junk Food: 0
- TV: 0
- Sleep: 8
- Fruits and Vegetables: 1
- Subject 6:
- Exercise: 5
- Junk Food: 6
- TV: 4
- Sleep: 7
- Fruits and Vegetables: 2
- Subject 7:
- Exercise: 3
- Junk](/v2/_next/image?url=https%3A%2F%2Fcontent.bartleby.com%2Fqna-images%2Fquestion%2F459a36fc-3250-437a-bd62-e2fb0c4f7a0b%2F3e3ae215-0d85-4a24-a301-fab38f994333%2Fqp0o62_processed.png&w=3840&q=75)
![The image displays a data table commonly seen in datasets used for educational purposes. Below is a detailed transcription and explanation of its content:
### Table Structure:
- **Name**: Lists the variables being measured.
- 1. Exercise
- 2. Junk_food
- 3. TV
- 4. Sleep
- 5. Fruits_and_vegetables
- **Type**: Indicates the data type for each variable, here all are "Numeric".
- **Width**: Specifies the width of data entries, set as 8 for all variables.
- **Decimals**: Defines the number of decimal places, which is 0 for each, indicating whole numbers.
- **Label**: Describes the question or measurement each variable represents.
- Exercise: "How often do you exercise?"
- Junk_food: "How often do you eat junk food?"
- TV: "How many hours of TV do you watch a day, on average?"
- Sleep: "How many hours of TV do you sleep each night, on average?" *(This appears to be a possible error in the label and might refer separately to sleep habits.)*
- Fruits_and_vegetables: "How many servings of fruits and vegetables do you eat each day?"
- **Values**: Indicates if there are any predefined values; marked as "None" for all variables.
- **Missing**: Notes any missing data specifications; marked "None" here.
- **Columns**: Specifies the number of columns; 8 for most variables, except 18 for Fruits_and_vegetables.
- **Align**: Describes the alignment of the data entries, here all are "Right".
- **Measure**: Indicates the level of measurement for statistical analysis.
- Exercise and Junk_food are "Ordinal", suggesting a ranked order.
- TV, Sleep, and Fruits_and_vegetables are "Scale", implying continuous data.
- **Role**: Specifies the role of the data in analysis, here all are marked as "Input".
This table is an example of how survey or observational study data might be structured for analysis in fields like health science, psychology, or nutrition education. Consistent formatting helps in seamless data entry and processing.](/v2/_next/image?url=https%3A%2F%2Fcontent.bartleby.com%2Fqna-images%2Fquestion%2F459a36fc-3250-437a-bd62-e2fb0c4f7a0b%2F3e3ae215-0d85-4a24-a301-fab38f994333%2Fc4n9w9_processed.png&w=3840&q=75)
![](/static/compass_v2/shared-icons/check-mark.png)
Null hypothesis : There is no relationship between the number of hours you watch TV and number of hours you sleep.
Alternative hypothesis : There is a negative relationship between the two , that is if you watch less TV, you sleep more.
( one-tailed)
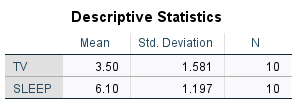
1) the Pearson correlation coefficient is computed by :
Then transfer TV and Sleep to the variable dialog box,
Tick Pearson and one-tailed then click OK.
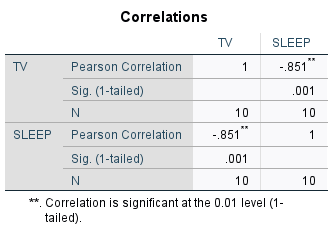
the results obtained are attached below :
Trending now
This is a popular solution!
Step by step
Solved in 2 steps with 2 images
![Blurred answer](/static/compass_v2/solution-images/blurred-answer.jpg)
![MATLAB: An Introduction with Applications](https://www.bartleby.com/isbn_cover_images/9781119256830/9781119256830_smallCoverImage.gif)
![Probability and Statistics for Engineering and th…](https://www.bartleby.com/isbn_cover_images/9781305251809/9781305251809_smallCoverImage.gif)
![Statistics for The Behavioral Sciences (MindTap C…](https://www.bartleby.com/isbn_cover_images/9781305504912/9781305504912_smallCoverImage.gif)
![Elementary Statistics: Picturing the World (7th E…](https://www.bartleby.com/isbn_cover_images/9780134683416/9780134683416_smallCoverImage.gif)
![The Basic Practice of Statistics](https://www.bartleby.com/isbn_cover_images/9781319042578/9781319042578_smallCoverImage.gif)
![Introduction to the Practice of Statistics](https://www.bartleby.com/isbn_cover_images/9781319013387/9781319013387_smallCoverImage.gif)