0.8 0.75 0.95 0.78 0.85
Q: A researcher is interested in studying how the number of books parents read to their children can…
A: In statistics, the independent variable is the variable which does not depend upon other variable,…
Q: The relative effectiveness of two different sales techniques was tested on 12 volunteer housewives.…
A: Given Information: Consider the given dataset: Housewife Technique 1 Technique 2 1 1 1 2 1 1…
Q: Personality psychologists often rely on rating scales, such as a 4-point rating scale (1=strongly…
A:
Q: For XYZ bank., one of the items to monitors is the credit balance of credit cards. One possible…
A: Given: The number of customers in each type of credit cards or the number of rows is r=41. The type…
Q: A driver for the Food delivery app makes $4.5 for each order she delivers. Assume that deliveries…
A:
Q: A basketball team is down by 2 points with only a few seconds remaining in the game. There is a 50%…
A: In statistics, chance shows how likely something will happen.
Q: The following table was generated from the sample data of 1010 junior high students regarding the…
A: Determine the multiple regression equation form the given computer output. From the given computer…
Q: 13% First interactions that result in a purchase 7% 3% 2% 93% Customers 'satisfied' with first…
A: Given data Total interactions = 12,000 Average percentage that were satisfied with first interaction…
Q: The following table was generated from the sample data of 10 junior high students regarding the…
A: The p-value for hours unsupervised (x1) is 0.513836.
Q: Provide one example of a real-world phenomenon that is well approximated as a Bernoulli trial.…
A: 1) Consider an experiment of tossing a coin n times, the coin shows only 2 outcomes(head or tail )…
Q: The hourly wages of a sample of 130 system analysts are given below mean=60 mode=73 median=74…
A: Given information- Sample size, n = 130 Mean, x-bar = 60 Mode = 73 Median = 74 Range = 20 Variance…
Q: You survey college bound and find that 85% plan to liv eon campus, 35% plan to have a car while at…
A: 85% plan to live on campus 35% plan to have a car while at campus 5% plan to live off campus and not…
Q: The National Electronic Injury Surveillance System tracks injuries reported from hospital admissions…
A: The hypotheses are given below: Null hypothesis: H0:p=0.50. Alternative hypothesis: H1:p≠0.50. Since…
Q: a box contains 5 white balls and 3 black balls. draw two balls without replacement. if x represents…
A: Given Information: There are 5 white balls and 3 black balls. Total number of balls is 8. Two balls…
Q: A pediatrician keeps some basic health information about all his patients. Here are four of the…
A: We know There are 4 types of variables Nominal Ordinal Interval Ratio
Q: 40 randomly selected trees growing in the median strip of a busy freeway. The height of each tree…
A: A histogram is a graphical representation of the distribution of numerical data. It usually…
Q: Draw a box-and-whisker plot for both sets of data on the same number line. Use the double…
A: Box plot is one of the chief methods to analyze a data graphically. It is used to compare how two…
Q: For a parallel structure of identical components, the system can succeed if at least one of the…
A:
Q: A study showed that 77% of patients purchase medications from community pharmacies. If you select a…
A: Suppose a random sample of size n is taken from a population with proportion p such that, n*p ≥ 10…
Q: Based on the imaginary scenario, identify which variable is an effect modifier: Taking a drug A…
A: Here we want to know variable which effect modifier.
Q: A poll of students showed that 45 percent liked basketball, 50 percent liked soccer, 40 percent…
A:
Q: The following table was generated from the sample data of 1010 junior high students regarding the…
A: Let y = b0+b1x1 +b2x2 be the multiple linear regression equation. Here the dependent variable y is…
Q: nt in free fall is fairly consistent, but can be affected by me (in minutes) spent in free fall for…
A: The data set are :-X :- 2.17, 2.75, 1.48, 1.87, 1.58Then, We will find the mean and standard…
Q: Suppose that the weekly unit sales for two small franchise stores in New York and Texas are recorded…
A: a boxplot is a graphical representation of the distribution in a data set using quartiles, minimum…
Q: An apartment management company wants to explore the consequences of allowing residents to have…
A: The data for predicting the resident rating given the data for number of dogs and years of facility…
Q: "A scientist divides a room of students into three groups. Each group takes a memory test in one of…
A: As we know that the variable which is being measured or recorded to see the effect is the dependent…
Q: The following table was generated from the sample data of 10 junior high students regarding the…
A: 1. From the regression output, it is clear that the coefficients corresponding to intercept, and for…
Q: ou have chosen three breeds of chicken for your farm after studying their egg-laying capabilities.…
A: Given that you have chosen three breeds of chicken for your farm after studying their egg-laying…
Q: A superstitious commuter believes that the number of people on the first car of the subway can…
A: Given data: Number of people on the subway Day Rating 23 10 7 3 40 9 38 2 9 7 32 2…
Q: A motion picture industry analyst is studying movies based on epic novels. The following data were…
A: a. The percent of variation in box office receipts can be attributed to the corresponding variation…
Q: On a certain hole, a golfer knows that he has a 70% chance of reaching the green (putting surface)…
A: Probability of reaching the green in one stoke (p1) = 0.7 Probability of putting the golf ball in…
Q: * A famous researcher observed that chimpanzees bunt and eat meat as part of their regular diet.…
A: (a) Use EXCEL to construct the scatter plot. EXCEL procedure: Go to EXCEL Go to Insert menu…
Q: he percentage of people in the population suffering from a certain disease is 32%. There is a test…
A: Obtain the probability that person does have the disease if the person takes the test and indicates…
Q: A researcher is investigating a new screening tool that is intended to help prevent the onset of…
A:
Q: The following table was generated from the sample data of 1010 junior high students regarding the…
A: Let the dependent variable Y denote the final grade. Let the first independent variable (x1) denote…
Q: You may need to use the appropriate technology to answer this question. poll tracks the favorite…
A: Answer Given Observed values 113374812819107________________________344______________________
Q: How many separate/distinct groups of participants are needed if they want to conduct this experiment…
A: Given: the coffee company, wants to determine how long caffeine lasts throughout the day when…
Q: A city uses three pumps to carry water from a river to a reservoir. Pumps A and B are new, and have…
A: As per the honor code we are entitled to solve only 3 subparts at a time so I am providing the same.…
Q: ora parallel structure of identical components, the system can succeed if at least one of the…
A:
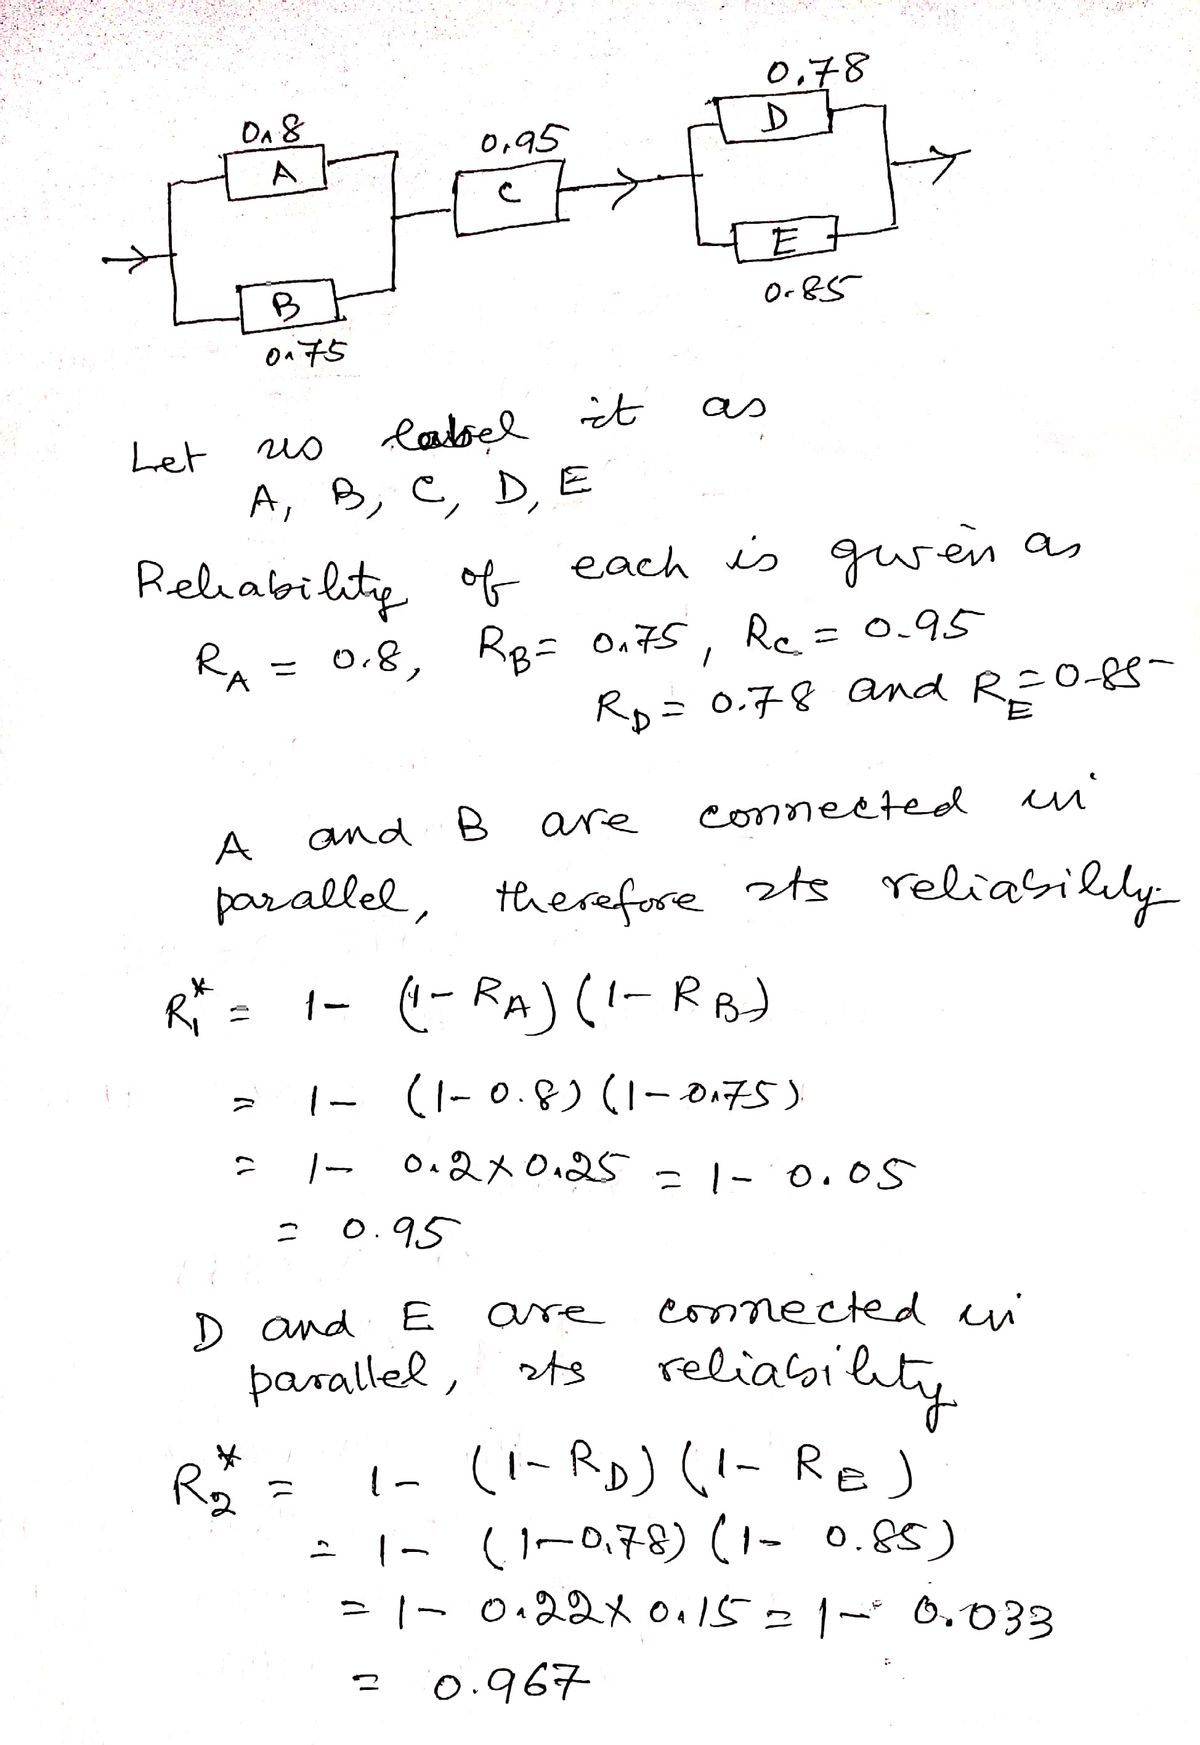
Reliability diagrams
Consider the following system for which each of the components
works independently of other components.
Calculate the reliability of the circuit if the probabilities of good
operation are those indicated on each component
of the diagram.
Step by step
Solved in 3 steps with 2 images
- The following table was generated from the sample data of 10 junior high students regarding the average number of hours they are unsupervised per night, the average number of hours they play video games per night, and their final grades in their math class. The dependent variable is the final grade, the first independent variable (x1) is the number of hours unsupervised each night, and the second independent variable (x2) is the number of hours of video games each night. Coefficients Standard Error t-Stat p-value Intercept 62.711817 4.607133 13.611896 0.000010 Hours Unsupervised 0.635048 0.915495 0.693666 0.513836 Hours Playing Video Games 7.528738 1.296727 5.805955 0.001145 Copy Data Step 1 of 2: Write the multiple regression equation for the computer output given. Round your answers to three decimal places. Answer 田 Tables 国 Keypad How to enter your answer (opens in new window) Keyboard Shortcuts X +Three friends are having a debate. They recently read that on average Americans drive 16 miles each way when computing to work by car (ABC News, 2007). Friend A suspects that the mean for Colorado residents is likely lower than the national average because the population density of Colorado increases the likelihood that people live closer to their jobs, while friend B suspects the mean for Colorado residents is likely higher than the national average. Friend C does not find either argument very convincing and instead suspects that the mean for Colorado residents is no different from the US population mean. The three friends bet a dinner at Alinea and set out to resolve the debate. Using a random sample of 20 Colorado residents, they calculate the mean for their sample to be 14.23 miles with a standard deviation of 2.34. The three friends did not pay very close attention in their statistics class, so they need your help making sense of these numbers. Compute the 95% confidence…Q9C Levi-Strauss Co manufactures clothing. The quality control department measures weekly values of different suppliers for the percentage difference of waste between the layout on the computer and the actual waste when the clothing is made (called run-up). The data is in the following table, and there are some negative values because sometimes the supplier is able to layout the pattern better than the computer ("Waste run up," 2013). Table #11.3.3: Run-ups for Different Plants Making Levi Strauss Clothing Plant 1 Plant 2 Plant 3 Plant 4 Plant 5 1.2 16.4 12.1 11.5 24 10.1 -6 9.7 10.2 -3.7 -2 -11.6 7.4 3.8 8.2 1.5 -1.3 -2.1 8.3 9.2 -3 4 10.1 6.6 -9.3 -0.7 17 4.7 10.2 8 3.2 3.8 4.6 8.8 15.8 2.7 4.3 3.9 2.7 22.3 -3.2 10.4 3.6 5.1 3.1 -1.7 4.2 9.6 11.2 16.8 2.4 8.5 9.8 5.9 11.3 0.3 6.3 6.5 13 12.3 3.5 9 5.7 6.8 16.9…
- A gym wishes to evaluate the effectiveness of its programs. When a new member joins the gym, they meet with a trainer who designs a recommended routine based on the member’s current fitness and their goals. The recommended routines can be classified into high, medium, or low effort. Historically, 68% of the new members get a high effort routine, 21% get a medium effort routine, and the rest get a low effort routine. After the first six months as members, the gym surveys the members’ adherence to the recommended routine. The gym classifies a member’s performance as optimal if they follow the recommended routine for the six months, or as inferior otherwise. According to the historical results of the survey, 84% of the members with a low effort routine, 22% of the members with a medium effort routine, and 69% of the members with a high effort routine report optimal performance. After the first six months of joining the gym, a member can obtain different results: they can either…The relative effectiveness of two different sales techniques was tested on 12 volunteer housewives. Each housewife was exposed to each sales technique and asked to buy a certain product, the same product in all cases. At the end of each exposure, each housewife rated the technique with a 1 if she felt she would have agreed to buy the product and a 0 if she probably would not have bought the product. Tech 1 2 3 4 1 1 1 2 0 1 1 1 1 0 5 6 7 8 9 10 1 Housewife 0 0 0 0 0 Test Ho: P₁=p₂ versus H₂: P₁ P₂ Use large sample approximations and compare results. 0 0 1 1 1 0 11 12 01 0 1 a) Use Cochran's test b) Rearrange the data and use McNemar's test c) use Fischer exact test d)Ignore the blocking effect in this experiment and treat the data as if 24 difference housewives were used.(Devore: Section 3.2 #15) Many manufacturers have quality control programs that include inspec- tion of incoming materials for defects. Suppose a computer manufacturer receives circuit boards in batches of five. Two boards are selected from each batch of inspection. We can represent possible outcomes of the selection process by pairs. For example, the pair (1,2) represents the selection of boards 1 and 2 for inspection. (a) List the ten different possible outcomes. (b) Suppose that boards 1 and 2 are the only defective boards in a batch. Two boards are to be chosen at random. Define X to be the number of defective boards observed among those inspected. Find the probability distribution (pmf) of X. (c) Let F denote the cdf of X. Determine F(0), F(1) and F(2); then obtain F(x) for all other x.
- Certain app allows you to order from different types of cuisine. According with the app's records 23% of the orders are to an American food restaurant, 38% to an Asian food restaurant, 17% to a Mexican food restaurant, 6% to a Dessert place, and the rest are to other types of restaurants. Assume that incoming orders are independent of each other.The following table was generated from the sample data of 1010 junior high students regarding the average number of hours they are unsupervised per night, the average number of hours they play video games per night, and their final grades in their math class. The dependent variable is the final grade, the first independent variable (x1x1) is the number of hours unsupervised each night, and the second independent variable (x2x2) is the number of hours of video games each night. Coefficients Standard Error t-Stat p-value Intercept 57.968435 7.227955 8.020032 0.000201 Hours Unsupervised 5.131630 1.314283 3.904510 0.007943 Hours Playing Video Games 1.067855 1.615039 0.661194 0.533040 Indicate if any of the independent variables could be eliminated at theGrade points are assigned such that an A receives 4 points, a B receives 3 points, a C receives 2 points, a D receives 1 point, and a F receives 0 points. Grades are weighted according to credit hours (units). If a student receives an A in a four-unit class, a D in a two-unit class, a B in a three-unit class and a C in a three-unit class, what is the student's grade point average? O A. 2.75 O B. 1.75 O C. 3.00 O D. 2.50 Click to select your answer. DELL XXX EVD disc RW DELL
- You are to submit 2 real life examples of statistical statements and state if they are biased or unbiased Example: A toothpaste advertisement states that 3 or 4 people prefer their product. This could be a biased survey, one that is not based on a random sample. They could have asked exactly 4 people about their product. An unbiased sample accurately represents the population. Each member of the population is equally to be chosen Example: A person wants to find out how many people prefer chocolate of vanilla ice cream. To get an unbiased sample, she would pick out a few of the ice cream shops in her town and survey people leaving the establishment.During the get-together for Gerdau developers, 17 employees sat around a large round table. Each of the collaborators received a paper that said if he should say only the truth or only a lie. During the dynamic performed, each one should say which colleagues were lying and which were telling the truth. At the end of the game, all employees who were participating said: "The two people next to me are liars". At a minimum, how many employees received the paper saying to tell only the truth?Indicate the dependent and independent variables, the number of levels for each independent variable, and whether each variable is within-subjects or between subjects 1. Individuals with anorexia and individuals with bulimia take a cognitive distortions test upon entering a treatment program for eating disorders and again three weeks later.