.., Based on the coefficient of determination (r) for each linear regression models developed, which of the two linear regression models should be used to predict the Final Grade in QMB 3600 and explain your decision.
.., Based on the coefficient of determination (r) for each linear regression models developed, which of the two linear regression models should be used to predict the Final Grade in QMB 3600 and explain your decision.

MATLAB: An Introduction with Applications
6th Edition
ISBN:9781119256830
Author:Amos Gilat
Publisher:Amos Gilat
Chapter1: Starting With Matlab
Section: Chapter Questions
Problem 1P

Related questions
Question
hello I just need help with the last part

Transcribed Image Text:Students in QMB 3600 - Quantitative Methods in Business course decided to research the relationship
between the Mid Term Exam, the average number of study hours spent per week during the semester and the
final course grade for a given student. A sample of containing data from a previous semester was provided by the
instructor and summarized in the following table:
Average Number of
study hours per week
Student #
Mid-Term Exam
Final Course Grade
Grade
1
50.0
2.0
65.0
60.0
4.0
85.0
55.0
3.5
78.0
4
85.0
6.0
90.0
55.0
5.0
70.0
6.
72.0
4.5
89.0
7
75.0
6.5
91.0
8
45.0
3.0
65.0
88.0
5.5
89.0
10
90.0
7.5
96.0
Develop a linear regression model, where Y is the Final Grade Course and X is the Mid-Term Exam.
Calculate the coefficient of determination (r), the coefficient of correlation (r), the variance (o?) for the model
and apply Hypothesis Testing to test the significance of the linear model for a = 0.05 exactly as demonstrated in
the Triple A Construction Example on page 121 of your textbook. Show all your calculations and follow the same
guidance provided in Problem #1.
Plot a scatter diagram for the data used in topic (a) and plot the linear regression model as well. Follow
the same guidance provided in Problem #1.
Develop a linear regression model, where Y is the Final Grade Course and X is the Average Number of
Study Hours per week. Calculate the coefficient of determination (r?), the coefficient of correlation (r), the variance
(o*) for the model and apply Hypothesis Testing to test the significance of the linear model for a = 0.05 exactly as
demonstrated in the Triple A Construction Example on page 121 of your textbook. Show all your calculations and
follow the same guidance provided in Problem #1.
Plot a scatter diagram for the data used in topic (c) and plot the linear regression model as well. Follow
the same guidance provided in Problem #1.
.., Based on the coefficient of determination (r) for each linear regression models developed, which of
the two linear regression models should be used to predict the Final Grade in QMB 3600 and explain your decision.
Expert Solution
Step 1
Pearson's correlation coefficient for the response variable Y and predictor variable X is given by,
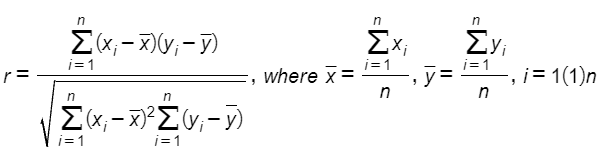
Here, n= number of observations = 10

Trending now
This is a popular solution!

Step by step
Solved in 3 steps with 1 images

Recommended textbooks for you
MATLAB: An Introduction with Applications
Statistics
ISBN:
9781119256830
Author:
Amos Gilat
Publisher:
John Wiley & Sons Inc

Probability and Statistics for Engineering and th…
Statistics
ISBN:
9781305251809
Author:
Jay L. Devore
Publisher:
Cengage Learning

Statistics for The Behavioral Sciences (MindTap C…
Statistics
ISBN:
9781305504912
Author:
Frederick J Gravetter, Larry B. Wallnau
Publisher:
Cengage Learning
MATLAB: An Introduction with Applications
Statistics
ISBN:
9781119256830
Author:
Amos Gilat
Publisher:
John Wiley & Sons Inc
Probability and Statistics for Engineering and th…
Statistics
ISBN:
9781305251809
Author:
Jay L. Devore
Publisher:
Cengage Learning
Statistics for The Behavioral Sciences (MindTap C…
Statistics
ISBN:
9781305504912
Author:
Frederick J Gravetter, Larry B. Wallnau
Publisher:
Cengage Learning

Elementary Statistics: Picturing the World (7th E…
Statistics
ISBN:
9780134683416
Author:
Ron Larson, Betsy Farber
Publisher:
PEARSON

The Basic Practice of Statistics
Statistics
ISBN:
9781319042578
Author:
David S. Moore, William I. Notz, Michael A. Fligner
Publisher:
W. H. Freeman

Introduction to the Practice of Statistics
Statistics
ISBN:
9781319013387
Author:
David S. Moore, George P. McCabe, Bruce A. Craig
Publisher:
W. H. Freeman