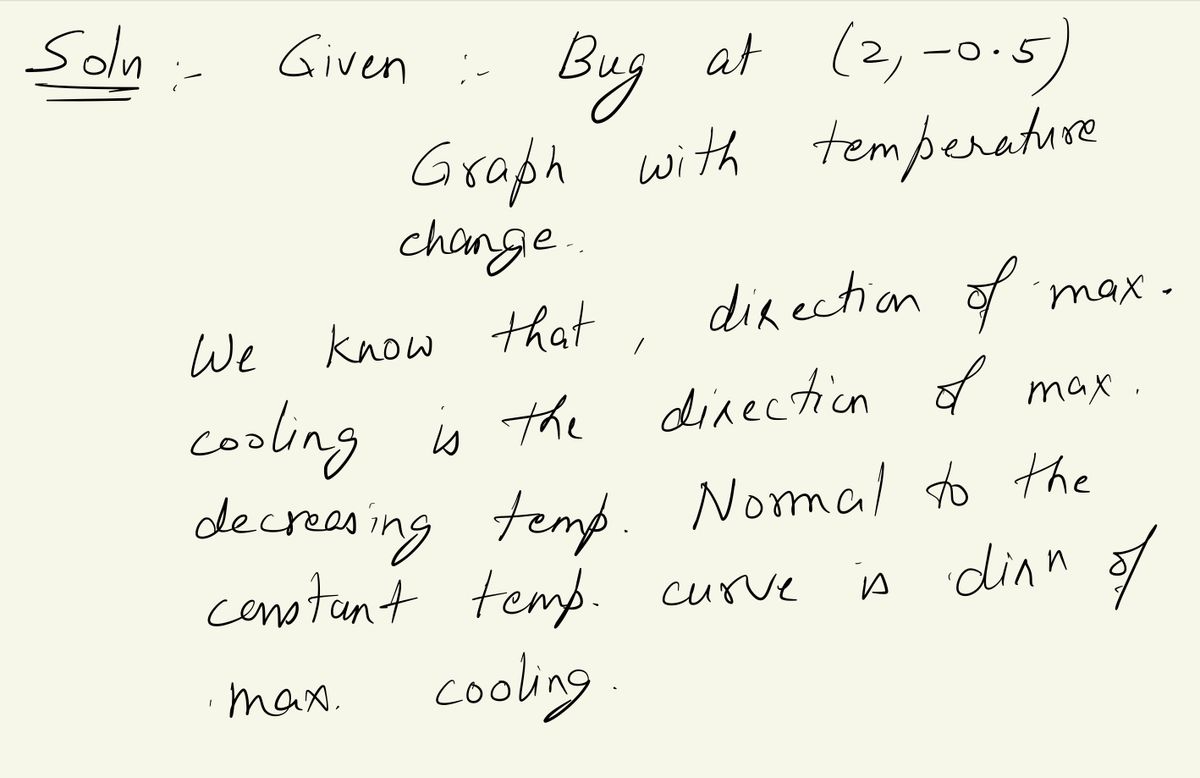
.) The figure below shows level curves for temperature. If a bug started at (2,-0.5), sketch the path it would take if it followed a path of maximum cooling. If you cannot reproduce the contour map for your answer, please provide sufficient information about the axis/coordinate values that your hand sketch of the path can be easily interpreted in the context of the contours. у 2 0 -1 -2 -2 I -1 C=-3 c=-2 C=-1 c=0 c=-1 c=-2 c=-3 0 c=0 c=1 c=2 c=3 1 2
.) The figure below shows level curves for temperature. If a bug started at (2,-0.5), sketch the path it would take if it followed a path of maximum cooling. If you cannot reproduce the contour map for your answer, please provide sufficient information about the axis/coordinate values that your hand sketch of the path can be easily interpreted in the context of the contours. у 2 0 -1 -2 -2 I -1 C=-3 c=-2 C=-1 c=0 c=-1 c=-2 c=-3 0 c=0 c=1 c=2 c=3 1 2

Related questions
Question
100%

Transcribed Image Text:.) The figure below shows level curves for temperature. If a bug started at (2,-0.5),
sketch the path it would take if it followed a path of maximum cooling. If you cannot reproduce
the contour map for your answer, please provide sufficient information about the axis/coordinate
values that your hand sketch of the path can be easily interpreted in the context of the contours.
y
2
H
0
-1
-2
-2
III
-1
c=-3
C=-2
c=-1
c=0
c=-1
c=-2
c=-3
0
c=0
c=1
c=2
c=3
1
2
X
Expert Solution
Step 1

Step by step
Solved in 2 steps with 2 images
