Videos
Incidence of breast cancer. The following graph (considered in Exercise 28 of Exercise Set R.1 without an equation) approximates the incidence of breast cancer I, per 100,000 women, as a function of age x. The equation for this graph is
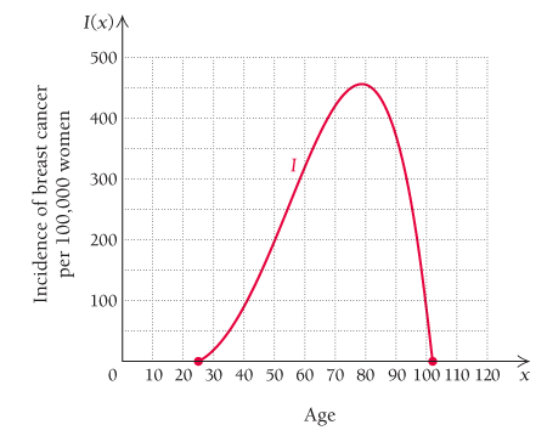
(Source: Based on data from the National Cancer Institute)
a. Use the graph to determine the domain of I.
b. Use the graph to determine the range of I.
c. What 10-yr age interval sees the greatest increase in the incidence of breast cancer? Explain how you determined this.
d. Approximately
Want to see the full answer?
Check out a sample textbook solution
Chapter R Solutions
Calculus and Its Applications, Books a la Carte Plus MyLab Math Access Card Package (11th Edition)
Additional Math Textbook Solutions
A Problem Solving Approach To Mathematics For Elementary School Teachers (13th Edition)
Introductory Statistics
A First Course in Probability (10th Edition)
College Algebra (7th Edition)
Pre-Algebra Student Edition
Elementary Statistics: Picturing the World (7th Edition)


- The graph of the function f in the figure below consists of line segments and a semicircle. Let g be the function given by x 9(x) = * f(t)dt. Determine all values of r, if any, where g has a relative minimum on the open interval (-9, 9). y 8 7 6 5 4 32 1 Graph of f x -10 -9 -8 -7 -6 -5 -4 -3 -2 -1 1 2 3 4 5 6 7 8 9 10 -1 -2 -3 -4 -5 -6 678 -7 -8arrow_forwardSolve pleasearrow_forwardA particle moves along the x-axis for 0 < t < 18 such that its velocity is given by the graph shown below. Find the total distance traveled by the particle during the time interval 4 ≤ t ≤ 8. 8 y 7 6 5 4 32 1 6 7 -1 1 2 3 4 5 -1 -2 -3 -4 56 -6 -8 8 00 Graph of v(t) x 9 10 11 12 13 14 15 16 17 18 19arrow_forward
- Using the Chain rule please and thank youarrow_forward10. [-/3 Points] DETAILS MY NOTES SESSCALCET2 7.2.047. Consider the following. aR- br (a) Set up an integral for the volume a solid torus (the donut-shaped solid shown in the figure) with radii br and aR. (Let a 8 and b = 2.) = dy (b) By interpreting the integral as an area, find the volume V of the torus. V = Need Help? Read It Watch Itarrow_forwardGraph y= log(x − 1) +4 10+ 9 8 7 6 5 4 32 1 10 -9 -8 -7 -6 -5 -4 -3 -2 -1 1 2 3 4 5 -1 6 7 8 9 10 -2 -3 -4 -5 -6 -7 -8 -9 -10arrow_forward
- Write an equation for the graph shown below. 5 4 3 2 1 -5-4-3-2-1 -1 1 2 3 4 5 f(x) = -2 -3 -4 -5arrow_forward1. We want to graph the function f(x) log4 x. In a table below, = find at three points with nice integer y-values (no rounding!) and then graph the function at right. Be sure to clearly indicate any asymptotes. (4 points) 3 2 1- -1 0 1 2 3 4 5 10 X log4(x) -1 -2 -3- 6 7 8 00arrow_forwardGraph y=log2(x+3) 10+ 9 8 7- 6 5 4 3 3 2 1 10 -9 -8 -7 -6 -5 -4 -3-2-1 1 2 3 4 5 6 7 8 7 8 9 10 -1 -2 -3 -4 -5 -6 -7- -8 -9 -10 Clear All Drawarrow_forward
 Algebra & Trigonometry with Analytic GeometryAlgebraISBN:9781133382119Author:SwokowskiPublisher:Cengage
 Glencoe Algebra 1, Student Edition, 9780079039897...AlgebraISBN:9780079039897Author:CarterPublisher:McGraw Hill
 Elementary Linear Algebra (MindTap Course List)AlgebraISBN:9781305658004Author:Ron LarsonPublisher:Cengage Learning
 College Algebra (MindTap Course List)AlgebraISBN:9781305652231Author:R. David Gustafson, Jeff HughesPublisher:Cengage Learning
 Trigonometry (MindTap Course List)TrigonometryISBN:9781337278461Author:Ron LarsonPublisher:Cengage Learning