
Concept explainers
Videos
Temperature The table shows the temperatures y (in degrees Fahrenheit) in a city over a 24-hour period. Let x represent the time of day, where x = 0 corresponds to 6 a.m.
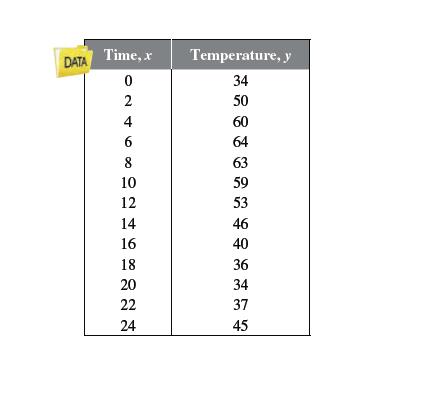
These data can be approximated by the model
Use a graphing utility to create a
same viewing window.
How well does the model fit the data?
Use the graph to approximate the times when the temperature was increasing and
decreasing.
Use the graph to approximate the maximum and minimum temperatures during this
24-hour period.
Could this model predict the temperatures in the city during the next 24-hour period?
Why or why not?

Trending nowThis is a popular solution!

Chapter P Solutions
WebAssign Printed Access Card for Larson's Trigonometry, 10th Edition, Single-Term


- Question 10 (5 points) (07.04 MC) Vectors u and v are shown in the graph. -12-11 -10 -9 -8 -7 -6 -5 What is proju? a -6.5i - 4.55j b -5.2i+2.6j с -4.7631 3.334j d -3.81i+1.905j < + 10 6 5 4 3 2 -3 -2 -10 1 -1 -2 -3 u -4 -5 -6 -7arrow_forwardFind the lengths of PR and OR in terms of the angles α and β. Find the angles ∠ONQ and ∠NPQ. Find the lengths of ON and PN in terms of the angle β. Find the length of PQ. Find the length of QR. Find the length of OM. Find the length of RM. What formula can you write down by noting that PR = QR + PQ? What formula can you write down by noting that OR = OM - RM?arrow_forward5) Solve the triangle. 2 95° 4 B с A) c=3.63, A=59.5°, B = 25.5° C) c = 4.63, A = 59.5°, B = 25.5° A B) c 4.63, A 25.5°, B = 59.5° = = D) c 5.63, A = 25.5°, B = 59.5°arrow_forward
- Find zw. Leave your answer in polar form. = လ 3π 2 z = 6 cos 6 cos 37 3π + i sin 2 57 W = 12 cos + i sin 6 6 ༠།ལྦ་arrow_forward10 Write the expression (1 – i) i)in the standard form a + bi.arrow_forward11) The letters r and 0 represent polar coordinates. Write the equation r sine = 10 using rectangular coordinates (x, y). A) x = 10y B) y = 10 C) x = 10 D) y = 10xarrow_forward
- 18) Find all the complex cube roots of - 8i. Leave your answers in polar form with the argument in degrees.arrow_forwardWrite the complex number √3 - i in polar form.arrow_forward2 10) The letters x and y represent rectangular coordinates. Write the equation x² + 4y = 4 using polar coordinates (r, e). A) 4 cos² 0 + sin² 0 = 4r C) r²(4 cos² 0 + sin² 0) = 4 B) cos² 0 + 4 sin² 0 = 4r D) r² (cos20 + 4 sin² 0) = 4arrow_forward
- 2) A radio transmission tower is 130 feet tall. How long should a guy wire be if it is to be attached 6 feet from the top and is to make an angle of 20° with the ground? Give your answer to the nearest tenth of a foot.arrow_forward4) Two sides and an angle are given. Determine whether the given information results in one triangle, two triangles, or no triangle at all. Solve any triangle(s) that results. b=6, c=7, B = 80° A) one triangle B=40°, A = 60°, a = 13 C) one triangle C 39°, A 61°, a = 15 = B) one triangle C=41°, A = 59°, a = 17 D) no trianglearrow_forward7) A painter needs to cover a triangular region 63 meters by 67 meters by 74 meters. A can of paint covers 70 square meters. How many cans will be needed?arrow_forward
 Glencoe Algebra 1, Student Edition, 9780079039897...AlgebraISBN:9780079039897Author:CarterPublisher:McGraw Hill
 Algebra & Trigonometry with Analytic GeometryAlgebraISBN:9781133382119Author:SwokowskiPublisher:Cengage
 College Algebra (MindTap Course List)AlgebraISBN:9781305652231Author:R. David Gustafson, Jeff HughesPublisher:Cengage Learning
 Algebra: Structure And Method, Book 1AlgebraISBN:9780395977224Author:Richard G. Brown, Mary P. Dolciani, Robert H. Sorgenfrey, William L. ColePublisher:McDougal Littell
 Trigonometry (MindTap Course List)TrigonometryISBN:9781337278461Author:Ron LarsonPublisher:Cengage Learning