
Concept explainers
Videos
The bar graph shows the differences among political identification groups on the Implicit Association Test that measure levels of racial prejudice. Higher scores indicate stronger bias.
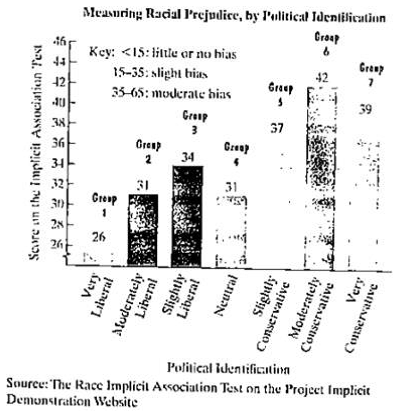
a. The data can be described by the following polynomial model of degree 3:
S = −0.02x3 + 0.4x2 + 1.2x + 22 + (−0.01x3 – 0.2x2 + 1.1x + 2).
In this polynomial model, S represents the score on the Implicit Association Test for political identification group x. Simplify the model.
b. Use the simplified form of the model from part (a) to find the score on the Implicit Association Test for the slightly conservative political identification group. Does the model underestimate or overestimate the score displayed by the bar graph? By how much?
Want to see the full answer?
Check out a sample textbook solution
Chapter P Solutions
EP COLLEGE ALGEBRA-MYMATHLAB
Additional Math Textbook Solutions
Precalculus: A Unit Circle Approach (3rd Edition)
Elementary Statistics ( 3rd International Edition ) Isbn:9781260092561
Calculus: Early Transcendentals (2nd Edition)
Elementary & Intermediate Algebra
College Algebra (Collegiate Math)
College Algebra (7th Edition)


- InThe Northern Lights are bright flashes of colored light between 50 and 200 miles above Earth. Suppose a flash occurs 150 miles above Earth. What is the measure of arc BD, the portion of Earth from which the flash is visible? (Earth’s radius is approximately 4000 miles.)arrow_forwarde). n! (n - 1)!arrow_forwardSuppose you flip a fair two-sided coin four times and record the result. a). List the sample space of this experiment. That is, list all possible outcomes that could occur when flipping a fair two-sided coin four total times. Assume the two sides of the coin are Heads (H) and Tails (T).arrow_forward
- e). n! (n - 1)!arrow_forwardEvaluate the following expression and show your work to support your calculations. a). 6! b). 4! 3!0! 7! c). 5!2! d). 5!2! e). n! (n - 1)!arrow_forwardAmy and Samiha have a hat that contains two playing cards, one ace and one king. They are playing a game where they randomly pick a card out of the hat four times, with replacement. Amy thinks that the probability of getting exactly two aces in four picks is equal to the probability of not getting exactly two aces in four picks. Samiha disagrees. She thinks that the probability of not getting exactly two aces is greater. The sample space of possible outcomes is listed below. A represents an ace, and K represents a king. Who is correct?arrow_forward
- Consider the exponential function f(x) = 12x. Complete the sentences about the key features of the graph. The domain is all real numbers. The range is y> 0. The equation of the asymptote is y = 0 The y-intercept is 1arrow_forwardThe graph shows Alex's distance from home after biking for x hours. What is the average rate of change from -1 to 1 for the function? 4-2 о A. -2 О B. 2 О C. 1 O D. -1 ty 6 4 2 2 0 X 2 4arrow_forwardWrite 7. √49 using rational exponents. ○ A. 57 47 B. 7 O C. 47 ○ D. 74arrow_forward

 Algebra & Trigonometry with Analytic GeometryAlgebraISBN:9781133382119Author:SwokowskiPublisher:Cengage