
Concept explainers
Videos
Population Statistics The table shows the life expectancies of a child (at birth) in the United States for selected years from 1940 through 2010.
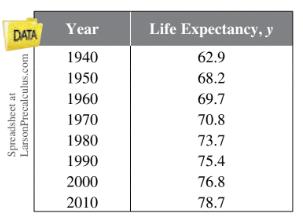
A model for the life expectancy during this period is
Where y represents the life expectancy and t is the time in years, with t = 0 corresponding to 1940.
(a) Use a graphing utility to graph the data from the table and the model in the same
viewing window. How well does the model fit the data? Explain.
(b) Determine the life expectancy in 1990 both graphically and algebraically.
(c) Use the graph to determine the year when life expectancy was approximately 70.1.
verify your answer algebraically.
(d) Find the y-intercept of the graph of the model. What does it represent in the context
of the problem?
(e) Do you think this model can be used to predict the life expectancy of a child 50
years from now?
Want to see the full answer?
Check out a sample textbook solution
Chapter P Solutions
Bundle: Trigonometry, 10th + Webassign Printed Access Card For Larson's Trigonometry, 10th Edition, Single-term


- Question 10 (5 points) (07.04 MC) Vectors u and v are shown in the graph. -12-11 -10 -9 -8 -7 -6 -5 What is proju? a -6.5i - 4.55j b -5.2i+2.6j с -4.7631 3.334j d -3.81i+1.905j < + 10 6 5 4 3 2 -3 -2 -10 1 -1 -2 -3 u -4 -5 -6 -7arrow_forwardFind the lengths of PR and OR in terms of the angles α and β. Find the angles ∠ONQ and ∠NPQ. Find the lengths of ON and PN in terms of the angle β. Find the length of PQ. Find the length of QR. Find the length of OM. Find the length of RM. What formula can you write down by noting that PR = QR + PQ? What formula can you write down by noting that OR = OM - RM?arrow_forward5) Solve the triangle. 2 95° 4 B с A) c=3.63, A=59.5°, B = 25.5° C) c = 4.63, A = 59.5°, B = 25.5° A B) c 4.63, A 25.5°, B = 59.5° = = D) c 5.63, A = 25.5°, B = 59.5°arrow_forward
- Find zw. Leave your answer in polar form. = လ 3π 2 z = 6 cos 6 cos 37 3π + i sin 2 57 W = 12 cos + i sin 6 6 ༠།ལྦ་arrow_forward10 Write the expression (1 – i) i)in the standard form a + bi.arrow_forward11) The letters r and 0 represent polar coordinates. Write the equation r sine = 10 using rectangular coordinates (x, y). A) x = 10y B) y = 10 C) x = 10 D) y = 10xarrow_forward
- 18) Find all the complex cube roots of - 8i. Leave your answers in polar form with the argument in degrees.arrow_forwardWrite the complex number √3 - i in polar form.arrow_forward2 10) The letters x and y represent rectangular coordinates. Write the equation x² + 4y = 4 using polar coordinates (r, e). A) 4 cos² 0 + sin² 0 = 4r C) r²(4 cos² 0 + sin² 0) = 4 B) cos² 0 + 4 sin² 0 = 4r D) r² (cos20 + 4 sin² 0) = 4arrow_forward
- 2) A radio transmission tower is 130 feet tall. How long should a guy wire be if it is to be attached 6 feet from the top and is to make an angle of 20° with the ground? Give your answer to the nearest tenth of a foot.arrow_forward4) Two sides and an angle are given. Determine whether the given information results in one triangle, two triangles, or no triangle at all. Solve any triangle(s) that results. b=6, c=7, B = 80° A) one triangle B=40°, A = 60°, a = 13 C) one triangle C 39°, A 61°, a = 15 = B) one triangle C=41°, A = 59°, a = 17 D) no trianglearrow_forward7) A painter needs to cover a triangular region 63 meters by 67 meters by 74 meters. A can of paint covers 70 square meters. How many cans will be needed?arrow_forward
 Algebra & Trigonometry with Analytic GeometryAlgebraISBN:9781133382119Author:SwokowskiPublisher:Cengage
 Big Ideas Math A Bridge To Success Algebra 1: Stu...AlgebraISBN:9781680331141Author:HOUGHTON MIFFLIN HARCOURTPublisher:Houghton Mifflin Harcourt
 Glencoe Algebra 1, Student Edition, 9780079039897...AlgebraISBN:9780079039897Author:CarterPublisher:McGraw Hill
 Functions and Change: A Modeling Approach to Coll...AlgebraISBN:9781337111348Author:Bruce Crauder, Benny Evans, Alan NoellPublisher:Cengage Learning