
Concept explainers
Videos
Big (Lark of) Men on Campus In 2007, 135 women received bachelor's degrees for every 100 men. According to the U.S. Department of Education, that gender imbalance has widened, as shown by the bar graph.
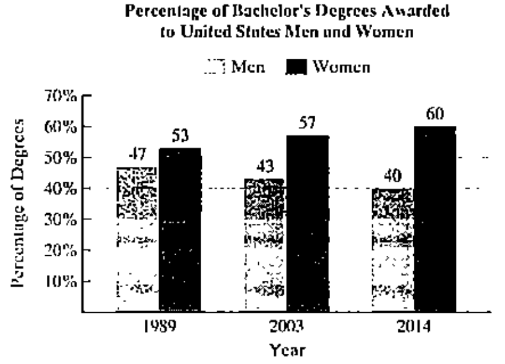
Source: U.S. Department of Education
The data for bachelor's degrees can he described by the following mathematical models:
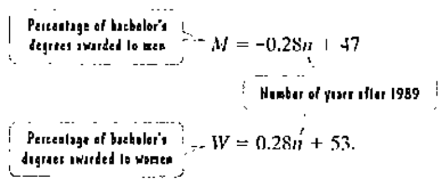
a. According to the first formula, what percentage or bachelor's degrees were awarded to men in 2003? Does this underestimate or overestimate the actual percent shown by the bar graph? By how much?
b. Use the given formulas to write a new formula with a rational expression that models the ratio of the percentage of bachelor's degrees received by men to the percentage received by women n years after 1989 Name this new mathematical model R, for ratio.
c. Use the formula for R to find the ratio or bachelor's degrees received by men to degrees received by women in 2014. According to the model, how many women received bachelor's degrees for every two men in 2014? How well does this describe the data shown by the graph?
Want to see the full answer?
Check out a sample textbook solution
Chapter P Solutions
College Algebra, Books a la Carte Edition Plus NEW MyMathLab -- Access Card Package (6th Edition)


- Evaluate the following expression and show your work to support your calculations. a). 6! b). 4! 3!0! 7! c). 5!2! d). 5!2! e). n! (n - 1)!arrow_forwardAmy and Samiha have a hat that contains two playing cards, one ace and one king. They are playing a game where they randomly pick a card out of the hat four times, with replacement. Amy thinks that the probability of getting exactly two aces in four picks is equal to the probability of not getting exactly two aces in four picks. Samiha disagrees. She thinks that the probability of not getting exactly two aces is greater. The sample space of possible outcomes is listed below. A represents an ace, and K represents a king. Who is correct?arrow_forwardConsider the exponential function f(x) = 12x. Complete the sentences about the key features of the graph. The domain is all real numbers. The range is y> 0. The equation of the asymptote is y = 0 The y-intercept is 1arrow_forward
- The graph shows Alex's distance from home after biking for x hours. What is the average rate of change from -1 to 1 for the function? 4-2 о A. -2 О B. 2 О C. 1 O D. -1 ty 6 4 2 2 0 X 2 4arrow_forwardWrite 7. √49 using rational exponents. ○ A. 57 47 B. 7 O C. 47 ○ D. 74arrow_forwardCan you check If my short explantions make sense because I want to make sure that I describe this part accuratelyarrow_forward
- 9! is 362, 880. What is 10!?arrow_forwardBruce and Krista are going to buy a new furniture set for their living room. They want to buy a couch, a coffee table, and a recliner. They have narrowed it down so that they are choosing between \[4\] couches, \[5\] coffee tables, and \[9\] recliners. How many different furniture combinations are possible?arrow_forwardCan you check if my step is correct?arrow_forward
 Glencoe Algebra 1, Student Edition, 9780079039897...AlgebraISBN:9780079039897Author:CarterPublisher:McGraw Hill
 Holt Mcdougal Larson Pre-algebra: Student Edition...AlgebraISBN:9780547587776Author:HOLT MCDOUGALPublisher:HOLT MCDOUGAL
 Big Ideas Math A Bridge To Success Algebra 1: Stu...AlgebraISBN:9781680331141Author:HOUGHTON MIFFLIN HARCOURTPublisher:Houghton Mifflin Harcourt
 Functions and Change: A Modeling Approach to Coll...AlgebraISBN:9781337111348Author:Bruce Crauder, Benny Evans, Alan NoellPublisher:Cengage Learning