Concept explainers
Videos
The graph below, called a
From the graph, it appears that the data follow a linear relation.
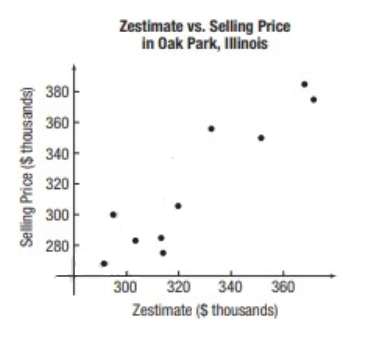
Pick two points from the scatter diagram. Treat the zestimate as the value of
Want to see the full answer?
Check out a sample textbook solution
Chapter F Solutions
Pearson eText for Precalculus: Concepts Through Functions, A Right Triangle Approach to Trigonometry -- Instant Access (Pearson+)


- 4. Suppose that A is made up of 5 column vectors in R³, and suppose that the rank(A)=3. a. How many solutions are there to Ax=0? Justify. b. What is a geometric description for the nullspace(A)? Justify. c. Do the column vectors of A span R³? Justify. d. Is A invertible? Justify.arrow_forward3. Suppose that A is 5 x 5 and rank(A)=4. Use this information to answer the following. a. Give a geometric description of nullspace(A). Justify. b. Is A invertible? Justify. c. Give a geometric description of the span of the column vectors of A. What space are the column vectors of A in? Justify. d. What is determinant of A? Justify.arrow_forward2. Consider the matrix: A || 1 1 -3 14 2 1 01 4 1 2 2 -26 1 -3 1 5] a) What is rank(A)? b) Is A invertible? Justify. c) Find the nullspace(A). Justify. d) Is the trivial solution the only solution to Ax=0? Justify. e) What is the span of the column vectors of A? Justify.arrow_forward
- E 5. Suppose that S={v € R²: v = [2x² - 3]}. Is S a subspace of R²? Prove or disprovearrow_forward6. Suppose that V1, V2 ER", show that span{v1, v2} is a subspace of Rn.arrow_forwardRa X 2) slots per pole per phase 3/31 180 Ko Sin (1) Kdl 1 sin (4) sin(3) Sin (30) اذا مرید شرح الكتب بس 0 بالفراغ 3) Cos (30) 0.866 4) Rotating 5) Synchronous speed, 120 Fo lasa! G s.1000-950 20:05 1000 Capper losses: 5kw Rotor input lookw 0.05 ined sove in peaper I need a detailed solution on paper please 6) 1 ۳/۱ وه اذا ميريد شرح الكتب فقط look DC 7) rotov Find the general solution of the following equations: +4y=tan2x 3 7357 Find the general solution of the following equations: - Qll y + y (³) = 0. 101arrow_forward
- B: 18060 msl Kd Ka, Sin (n) I sin () sin(30) Sin (30) اذا ميريد شرح الكتب بس 0 بالفراغ 3) Cos (30) 0.866 4) Rotating 5) Synchronous speed, 120 x 50 G 5005 1000 s = 1000-950 Copper bosses 5kW /0001 Rotor input 5 : loo kw 0.05 6) 1 اذا ميريد شرح الكتب فقط ١٥٠ 7) rotov DC ined sove in Deaper I need a detailed solution on paper please dy x+2y-4 = dx 2x-y-3 Find the general solution of the following equations: 02//yl-4y+13y=esinarrow_forward1) R₂ = X2 2) slots per pole per phase = 3/31 B msl kd 180 60 Kal Sin (1) I sin () sin(30) Sin (30) اذا ميريد شرح الكتب بس 0 بالفراغ 3) Cos (30) 0.866 4) Rotating 5) Synchronous speed, 120 x 50 G 5005 1000 s = 1000-950 Copper bosses 5kW Rotor input: 5 0.05 loo kw 6) 1 /0001 اذا ميريد شرح الكتب فقط look 7) rotov DC ined sove in peaper I need a detailed solution on paper please Q1// Find the solution of: 'y' = x² +376 x4+316 xyo Q2 Find the solution of the initial-valued problems: ex-y y' +exarrow_forwardR₂ = X2 2) slots per pole per phase = 3/31 B-18060 msl kd Kasi Sin (1) I sin (6) sin(30) Sin (30) اذا ميريد شرح الكتب بس 0 بالفراغ 3) Cos (30) 0.866 4) Rotating 5) Synchronous speed s = 1000-950 1000 Copper losses: 5kw Rotor input 5 0.05 6) 1 120 x 50 G loo kw ined sove in peaper I need a detailed solution on paper please Q3// x²y// +xy/ + (x² - ½) y = x³/². اذا ميريد شرح الكتب فقط look 7) rotor DC Q4// x²y// - (2x+x²)y/ + (2 + x)y = x³. dy 2x+2y+4 = dx 2x-y-3arrow_forward
- ۳/۱ R2X2 2) slots per pole per phase = 3/31 B, 18060 msl Kas Sin() 1sin() sin(30) Sin (30) kd اذا ميريد شرح الكتب بس 0 بالفراغ 3) Cos (30) 0.866 4) Rotating 5) Synchronous speeds S = 1000-950 1000 Copper bosses 5kw 120*50 loca G Rotor input 5 loo kw 6) 1 0.05 اذا ميريد شرح الكتب فقط lookw 7) rotor DC ined sove in peaper I need a detailed solution on paper please 064 Q1// Find the solution of QI/Find the solution of Inxy= 7357 x+2y³ y' = xy3arrow_forwardR₂ = X2 2) slots per pole per phase 3/31 msl 180 60 Kd Ka Sin (1) Isin (6) sin(30) Sin (30) اذا ميريد شرح الكتب بس 0 بالفراغ 3) Cos (30) 0.866 4) Rotating 5) Synchronous speed, 120*50 1000 6 S = 1000-950 1000 Copper bosses: 5kw Rotor input 5 0.05 : loo kw 6) 1 اذا ميريد شرح الكتب فقط 100 7) rotor DC ined sove in peaper I need a detailed solution on paper please Find the general solution of the following equations: Q2lyl-4y+13y=esinx. Find the general solution of the following equations: " Qly (49) - 16y= 0. 151arrow_forward۳/۱ R₂ = X2 2) slots per pole per phase = 3/31 B-18060 msl kd Kasi Sin (1) I sin (6) sin(30) Sin (30) اذا ميريد شرح الكتب بس 0 بالفراغ 3) Cos (30) 0.866 4) Rotating 5) Synchronous speed s = 1000-950 1000 Copper losses: 5kw Rotor input 5 0.05 6) 1 120 x 50 G loo kw اذا میرید شرح الكتب فقط look 7) rotor DC ined sove in peaper I need a detailed solution on paper dy please 04 12=-cosx.y + 2cosx with y(x) = 1 か 'Oy + xlny + xe")dx + (xsiny + xlnx +*dy=0. 01arrow_forward
 Functions and Change: A Modeling Approach to Coll...AlgebraISBN:9781337111348Author:Bruce Crauder, Benny Evans, Alan NoellPublisher:Cengage Learning
 Algebra: Structure And Method, Book 1AlgebraISBN:9780395977224Author:Richard G. Brown, Mary P. Dolciani, Robert H. Sorgenfrey, William L. ColePublisher:McDougal Littell