Concept explainers
Videos
The graph below, called a
From the graph, it appears that the data follow a linear relation.
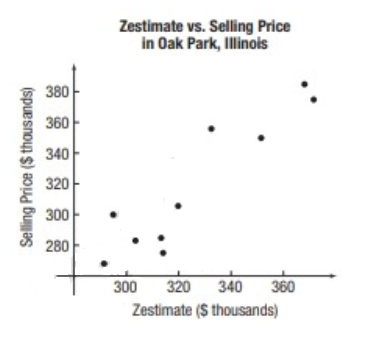
Imagine drawing a line through the data that appears to fit the data well. Do you believe the slope of the line would be positive, negative, or close to zero? Why?
The slope of the line would be positive, negative, or close to zero with reason, by imagine drawing a line through the data that appears to fit the data well.
Answer to Problem 1CP
Solution:
The line passing through the points on scatter plot is slant upward, so the slope of the line would be positive.
Explanation of Solution
Given information:
The data below show the “zestimate”-the selling price of a home as predicted by the folks at Zillow and the actual selling price of the home, for the home in Oak Park Illinois.
The graph below, called a scatter diagram, shows the points

Explanation:
It is observed that, line passing through the points on scatter plot is slant upward.
It is known that, when the slope of the line is positive, the line slants upward.
When the slope of the line is negative, the line slants downward.
When the slope of the line is zero, the line is horizontal.
When the slope of the line is undefined, the line is vertical.
The line passing through the points on scatter plot is slant upward, so the slope of the line would be positive.
Want to see more full solutions like this?
Chapter F Solutions
PRECALCULUS:CONCEPTS...-MYLAB+ETEXT


- please solve with full steps pleasearrow_forward4. Identify at least two mistakes in Francisco's work. Correct the mistakes and complete the problem by using the second derivative test. 2f 2X 2. Find the relative maximum and relative minimum points of f(x) = 2x3 + 3x² - 3, using the First Derivative Test or the Second Derivative Test. bx+ bx 6x +6x=0 12x- af 24 = 0 x=0 108 -2 5. Identify at least three mistakes in Francisco's work. Then sketch the graph of the function and label the local max and local min. 1. Find the equation of the tangent line to the curve y=x-2x3+x-2 at the point (1.-2). Sketch the araph of y=x42x3+x-2 and the tangent line at (1,-2) y' = 4x-6x y' (1) = 4(1) - 667 - 2 = 4(-2)4127-6(-2) 5-8-19-20 =arrow_forward۳/۱ R2X2 2) slots per pole per phase = 3/31 B=18060 msl Ka, Sin (1) Kdl Isin ( sin(30) Sin (30) اذا ميريد شرح الكتب بس 0 بالفراغ 3) Cos (30) 0.866 4) Rotating 120*50 5) Synchronous speed, 120 x 50 S1000-950 1000 Copper losses 5kw 50105 Rotor input 5 0.05 loo kw 6) 1 1000rpm اذا ميريد شرح الكتب فقط Look = 7) rotov DC ined sove in peaper PU + 96er Which of the following is converge, and which diverge? Give reasons for your answers with details. When your answer then determine the convergence sum if possible. 3" 6" Σ=1 (2-1) π X9arrow_forward
- 1 R2 X2 2) slots per pole per phase = 3/31 B = 180 - 60 msl Kd Kol, Sin (no) Isin (6) 2 sin(30) Sin (30) اذا ميريد شرح الكتب بس 0 بالفراغ 3) Cos (30) 0.866 4) Rotating 5) Synchronous speed; 120*50 Looo rem G S = 1000-950 solos 1000 Copper losses: 5kw Rotor input: 5 loo kw 0.05 1 اذا میرید شرح الكتب فقط look 7) rotor DC ined sove in pea PU+96er Q2// Find the volume of the solid bounded above by the cynnuer 2=6-x², on the sides by the cylinder x² + y² = 9, and below by the xy-plane. Q041 Convert 2 2x-2 Lake Gex 35 w2x-xབོ ,4-ཙཱཔ-y √4-x²-yz 21xy²dzdydx to(a) cylindrical coordinates, (b) Spherical coordinates. 201 25arrow_forwardshow full work pleasearrow_forward3. Describe the steps you would take to find the absolute max of the following function using Calculus f(x) = : , [-1,2]. Then use a graphing calculator to x-1 x²-x+1 approximate the absolute max in the closed interval.arrow_forward
- (7) (12 points) Let F(x, y, z) = (y, x+z cos yz, y cos yz). Ꮖ (a) (4 points) Show that V x F = 0. (b) (4 points) Find a potential f for the vector field F. (c) (4 points) Let S be a surface in R3 for which the Stokes' Theorem is valid. Use Stokes' Theorem to calculate the line integral Jos F.ds; as denotes the boundary of S. Explain your answer.arrow_forward(3) (16 points) Consider z = uv, u = x+y, v=x-y. (a) (4 points) Express z in the form z = fog where g: R² R² and f: R² → R. (b) (4 points) Use the chain rule to calculate Vz = (2, 2). Show all intermediate steps otherwise no credit. (c) (4 points) Let S be the surface parametrized by T(x, y) = (x, y, ƒ (g(x, y)) (x, y) = R². Give a parametric description of the tangent plane to S at the point p = T(x, y). (d) (4 points) Calculate the second Taylor polynomial Q(x, y) (i.e. the quadratic approximation) of F = (fog) at a point (a, b). Verify that Q(x,y) F(a+x,b+y). =arrow_forward(6) (8 points) Change the order of integration and evaluate (z +4ry)drdy . So S√ ² 0arrow_forward
- (10) (16 points) Let R>0. Consider the truncated sphere S given as x² + y² + (z = √15R)² = R², z ≥0. where F(x, y, z) = −yi + xj . (a) (8 points) Consider the vector field V (x, y, z) = (▼ × F)(x, y, z) Think of S as a hot-air balloon where the vector field V is the velocity vector field measuring the hot gasses escaping through the porous surface S. The flux of V across S gives the volume flow rate of the gasses through S. Calculate this flux. Hint: Parametrize the boundary OS. Then use Stokes' Theorem. (b) (8 points) Calculate the surface area of the balloon. To calculate the surface area, do the following: Translate the balloon surface S by the vector (-15)k. The translated surface, call it S+ is part of the sphere x² + y²+z² = R². Why do S and S+ have the same area? ⚫ Calculate the area of S+. What is the natural spherical parametrization of S+?arrow_forward(1) (8 points) Let c(t) = (et, et sint, et cost). Reparametrize c as a unit speed curve starting from the point (1,0,1).arrow_forward(9) (16 points) Let F(x, y, z) = (x² + y − 4)i + 3xyj + (2x2 +z²)k = - = (x²+y4,3xy, 2x2 + 2²). (a) (4 points) Calculate the divergence and curl of F. (b) (6 points) Find the flux of V x F across the surface S given by x² + y²+2² = 16, z ≥ 0. (c) (6 points) Find the flux of F across the boundary of the unit cube E = [0,1] × [0,1] x [0,1].arrow_forward
 Functions and Change: A Modeling Approach to Coll...AlgebraISBN:9781337111348Author:Bruce Crauder, Benny Evans, Alan NoellPublisher:Cengage Learning
 Algebra: Structure And Method, Book 1AlgebraISBN:9780395977224Author:Richard G. Brown, Mary P. Dolciani, Robert H. Sorgenfrey, William L. ColePublisher:McDougal Littell