To graph:
The solutions for the provided system of linear inequalities.
Answer to Problem 1E
Solution:
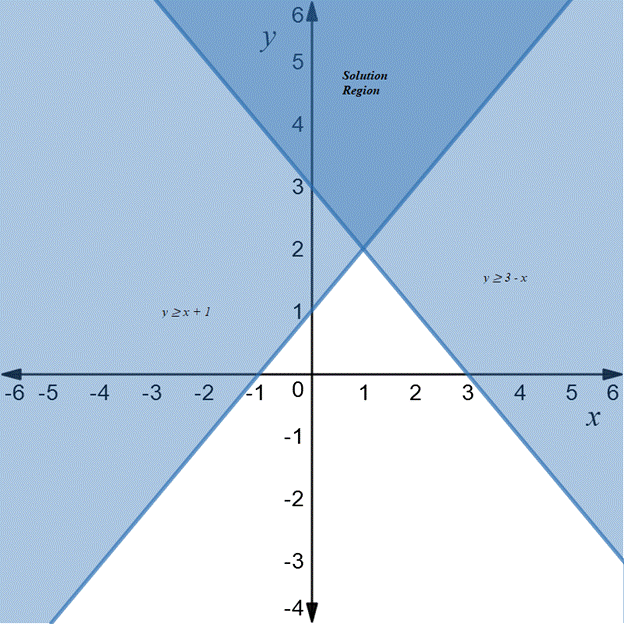
The solutions of the system is the region contained in the graphs of both inequalities.

Explanation of Solution
Given:
The provided system of linear inequalities is
Procedure:
Graphing the solutions of a system of linear inequalities:
Step 1: Graph each inequality in the system on the same set of axes.
Step 2: The solutions of the system are the points common to the graphs of all the inequalities in the system.
Calculation:
Consider the inequalities
Graph both the inequalities on the same set of axes.
Since both the inequality symbols are
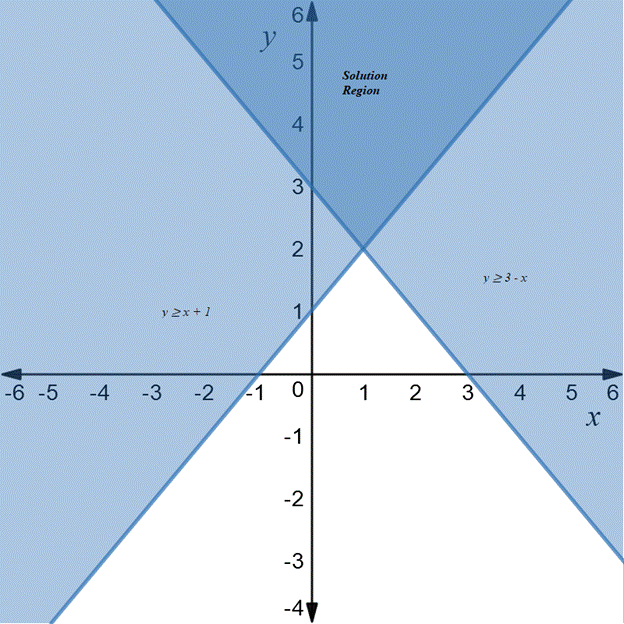
The solutions of the system are the regions shown by the darkest shading in the graph below.
Graph:

Therefore, the solutions of the system is the region contained in the graphs of both inequalities.
Want to see more full solutions like this?
Chapter D Solutions
MYLAB MATH WITH PEARSON ETEXT -- 24 MON
- Question 2: (10 points) Evaluate the definite integral. Use the following form of the definition of the integral to evaluate the integral: Theorem: Iff is integrable on [a, b], then where Ax = (ba)/n and x₂ = a + i^x. You might need the following formulas. IM³ L² (3x² (3x²+2x- 2x - 1)dx. n [f(z)dz lim f(x)Az a n→∞ i=1 n(n + 1) 2 n i=1 n(n+1)(2n+1) 6arrow_forwardFor the system consisting of the three planes:plane 1: -4x + 4y - 2z = -8plane 2: 2x + 2y + 4z = 20plane 3: -2x - 3y + z = -1a) Are any of the planes parallel and/or coincident? Justify your answer.b) Determine if the normals are coplanar. What does this tell you about the system?c) Solve the system if possible. Show a complete solution (do not use matrix operations). Classify the system using the terms: consistent, inconsistent, dependent and/or independent.arrow_forwardFor the system consisting of the three planes:plane 1: -4x + 4y - 2z = -8plane 2: 2x + 2y + 4z = 20plane 3: -2x - 3y + z = -1a) Are any of the planes parallel and/or coincident? Justify your answer.b) Determine if the normals are coplanar. What does this tell you about the system?c) Solve the system if possible. Show a complete solution (do not use matrix operations). Classify the system using the terms: consistent, inconsistent, dependent and/or independent.arrow_forward
- Open your tool box and find geometric methods, symmetries of even and odd functions and the evaluation theorem. Use these to calculate the following definite integrals. Note that you should not use Riemann sums for this problem. (a) (4 pts) (b) (2 pts) 3 S³ 0 3-x+9-dz x3 + sin(x) x4 + cos(x) dx (c) (4 pts) L 1-|x|dxarrow_forwardA movie studio wishes to determine the relationship between the revenue generated from the streaming of comedies and the revenue generated from the theatrical release of such movies. The studio has the following bivariate data from a sample of fifteen comedies released over the past five years. These data give the revenue x from theatrical release (in millions of dollars) and the revenue y from streaming (in millions of dollars) for each of the fifteen movies. The data are displayed in the Figure 1 scatter plot. Theater revenue, x Streaming revenue, y (in millions of (in millions of dollars) dollars) 13.2 10.3 62.6 10.4 20.8 5.1 36.7 13.3 44.6 7.2 65.9 10.3 49.4 15.7 31.5 4.5 14.6 2.5 26.0 8.8 28.1 11.5 26.1 7.7 28.2 2.8 60.7 16.4 6.7 1.9 Streaming revenue (in millions of dollars) 18+ 16+ 14 12+ xx 10+ 8+ 6+ 2- 0 10 20 30 40 50 60 70 Theater revenue (in millions of dollars) Figure 1 Send data to calculator Send data to Excel The least-squares regression line for these data has a slope…arrow_forward14arrow_forward
 Discrete Mathematics and Its Applications ( 8th I...MathISBN:9781259676512Author:Kenneth H RosenPublisher:McGraw-Hill Education
 Mathematics for Elementary Teachers with Activiti...MathISBN:9780134392790Author:Beckmann, SybillaPublisher:PEARSON
 Thinking Mathematically (7th Edition)MathISBN:9780134683713Author:Robert F. BlitzerPublisher:PEARSON
 Discrete Mathematics With ApplicationsMathISBN:9781337694193Author:EPP, Susanna S.Publisher:Cengage Learning,
 Pathways To Math Literacy (looseleaf)MathISBN:9781259985607Author:David Sobecki Professor, Brian A. MercerPublisher:McGraw-Hill Education


