Pre-Algebra, Student Edition
1st Edition
ISBN: 9780078885150
Author: McGraw-Hill
Publisher: Glencoe/McGraw-Hill
expand_more
expand_more
format_list_bulleted
Videos
Question
Chapter CSB1.6, Problem 1E
To determine
To graph: The inequality
Expert Solution & Answer
Explanation of Solution
Given:
The inequality is
Calculation:
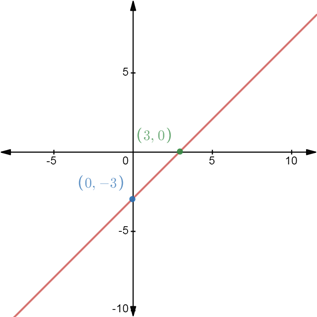
First plot the equation of line
Take some of points for the coordinates.
Consider x = 0,
Thus, the coordinate is (0, -3).
Consider x = 3,
Thus, the coordinate is (3, 0).
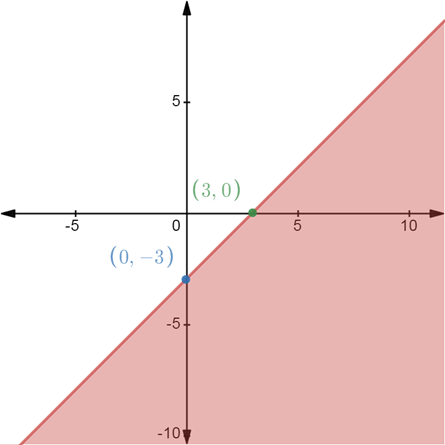
The graph of the equation can be drawn by joining these two coordinates as follows:
Now apply the inequality condition (less than equal to) by shading the area below the line as follows:
Want to see more full solutions like this?
Subscribe now to access step-by-step solutions to millions of textbook problems written by subject matter experts!
Additional Math Textbook Solutions
Find more solutions based on key concepts
IQ Scores. In Exercises 9–12, find the indicated IQ score and round to the nearest whole number. The graphs dep...
Elementary Statistics (13th Edition)
Integral Test Use the Integral Test to determine the convergence or divergence of the following series, or stat...
Calculus: Early Transcendentals (2nd Edition)
The following set of data is from sample of n=5: a. Compute the mean, median, and mode. b. Compute the range, v...
Basic Business Statistics, Student Value Edition
Low-Birth-Weight Babies (Example 10) Babies born weighing 2500 grams (about 5.5 pounds) or less are called low-...
Introductory Statistics
Finding Cartesian from Parametric Equations
Exercises 1–18 give parametric equations and parameter intervals fo...
University Calculus: Early Transcendentals (4th Edition)
Suppose that A and B are mutually exclusive events for which P(A) = .3 and P(B) = .5. What is the probability t...
A First Course in Probability (10th Edition)
Knowledge Booster


Learn more about
Need a deep-dive on the concept behind this application? Look no further. Learn more about this topic, algebra and related others by exploring similar questions and additional content below.Similar questions
- InThe Northern Lights are bright flashes of colored light between 50 and 200 miles above Earth. Suppose a flash occurs 150 miles above Earth. What is the measure of arc BD, the portion of Earth from which the flash is visible? (Earth’s radius is approximately 4000 miles.)arrow_forwarde). n! (n - 1)!arrow_forwardSuppose you flip a fair two-sided coin four times and record the result. a). List the sample space of this experiment. That is, list all possible outcomes that could occur when flipping a fair two-sided coin four total times. Assume the two sides of the coin are Heads (H) and Tails (T).arrow_forward
- e). n! (n - 1)!arrow_forwardEvaluate the following expression and show your work to support your calculations. a). 6! b). 4! 3!0! 7! c). 5!2! d). 5!2! e). n! (n - 1)!arrow_forwardAmy and Samiha have a hat that contains two playing cards, one ace and one king. They are playing a game where they randomly pick a card out of the hat four times, with replacement. Amy thinks that the probability of getting exactly two aces in four picks is equal to the probability of not getting exactly two aces in four picks. Samiha disagrees. She thinks that the probability of not getting exactly two aces is greater. The sample space of possible outcomes is listed below. A represents an ace, and K represents a king. Who is correct?arrow_forward
- Consider the exponential function f(x) = 12x. Complete the sentences about the key features of the graph. The domain is all real numbers. The range is y> 0. The equation of the asymptote is y = 0 The y-intercept is 1arrow_forwardThe graph shows Alex's distance from home after biking for x hours. What is the average rate of change from -1 to 1 for the function? 4-2 о A. -2 О B. 2 О C. 1 O D. -1 ty 6 4 2 2 0 X 2 4arrow_forwardWrite 7. √49 using rational exponents. ○ A. 57 47 B. 7 O C. 47 ○ D. 74arrow_forward
arrow_back_ios
SEE MORE QUESTIONS
arrow_forward_ios
Recommended textbooks for you
 Algebra and Trigonometry (6th Edition)AlgebraISBN:9780134463216Author:Robert F. BlitzerPublisher:PEARSON
 Contemporary Abstract AlgebraAlgebraISBN:9781305657960Author:Joseph GallianPublisher:Cengage Learning
 Linear Algebra: A Modern IntroductionAlgebraISBN:9781285463247Author:David PoolePublisher:Cengage Learning
 Algebra And Trigonometry (11th Edition)AlgebraISBN:9780135163078Author:Michael SullivanPublisher:PEARSON
 Introduction to Linear Algebra, Fifth EditionAlgebraISBN:9780980232776Author:Gilbert StrangPublisher:Wellesley-Cambridge Press
 College Algebra (Collegiate Math)AlgebraISBN:9780077836344Author:Julie Miller, Donna GerkenPublisher:McGraw-Hill Education
Algebra and Trigonometry (6th Edition)
Algebra
ISBN:9780134463216
Author:Robert F. Blitzer
Publisher:PEARSON
Contemporary Abstract Algebra
Algebra
ISBN:9781305657960
Author:Joseph Gallian
Publisher:Cengage Learning
Linear Algebra: A Modern Introduction
Algebra
ISBN:9781285463247
Author:David Poole
Publisher:Cengage Learning
Algebra And Trigonometry (11th Edition)
Algebra
ISBN:9780135163078
Author:Michael Sullivan
Publisher:PEARSON
Introduction to Linear Algebra, Fifth Edition
Algebra
ISBN:9780980232776
Author:Gilbert Strang
Publisher:Wellesley-Cambridge Press
College Algebra (Collegiate Math)
Algebra
ISBN:9780077836344
Author:Julie Miller, Donna Gerken
Publisher:McGraw-Hill Education
2.1 Introduction to inequalities; Author: Oli Notes;https://www.youtube.com/watch?v=D6erN5YTlXE;License: Standard YouTube License, CC-BY
GCSE Maths - What are Inequalities? (Inequalities Part 1) #56; Author: Cognito;https://www.youtube.com/watch?v=e_tY6X5PwWw;License: Standard YouTube License, CC-BY
Introduction to Inequalities | Inequality Symbols | Testing Solutions for Inequalities; Author: Scam Squad Math;https://www.youtube.com/watch?v=paZSN7sV1R8;License: Standard YouTube License, CC-BY