
Videos
In each of Exercises C.119–C.125, we have presented a study conducted using randomized block ANOVA and have displayed corresponding computer output that contains a randomized block ANOVA table, marginal
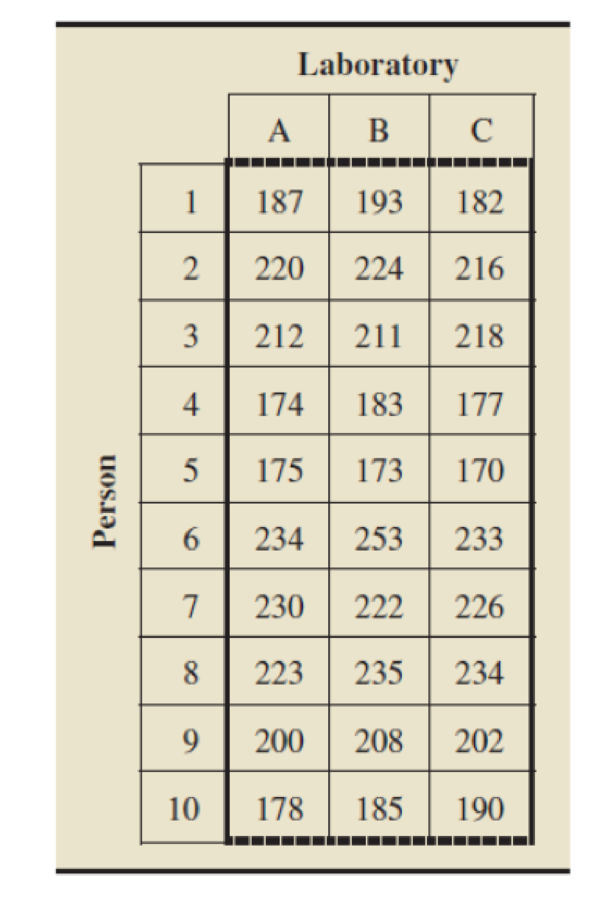
C.119 Cholesterol Testing. A large health care organization uses three laboratories for the routine analysis of blood samples. It is important that the three labs provide equivalent test results. To check that, blood samples are obtained from 10 randomly selected individuals; each blood sample is then divided into three blood subsamples of equal volume; and then the three blood subsamples from each person are sent to different labs. For this problem, the analysis is confined to assessing the measurement of the total cholesterol level for a person. The data are in the following table. We performed a randomized block ANOVA on the data. Output C.34 on page C-82 shows the resulting computer output and also supplies a table of marginal means. Output C.35 on page C-82 shows the interaction plots.
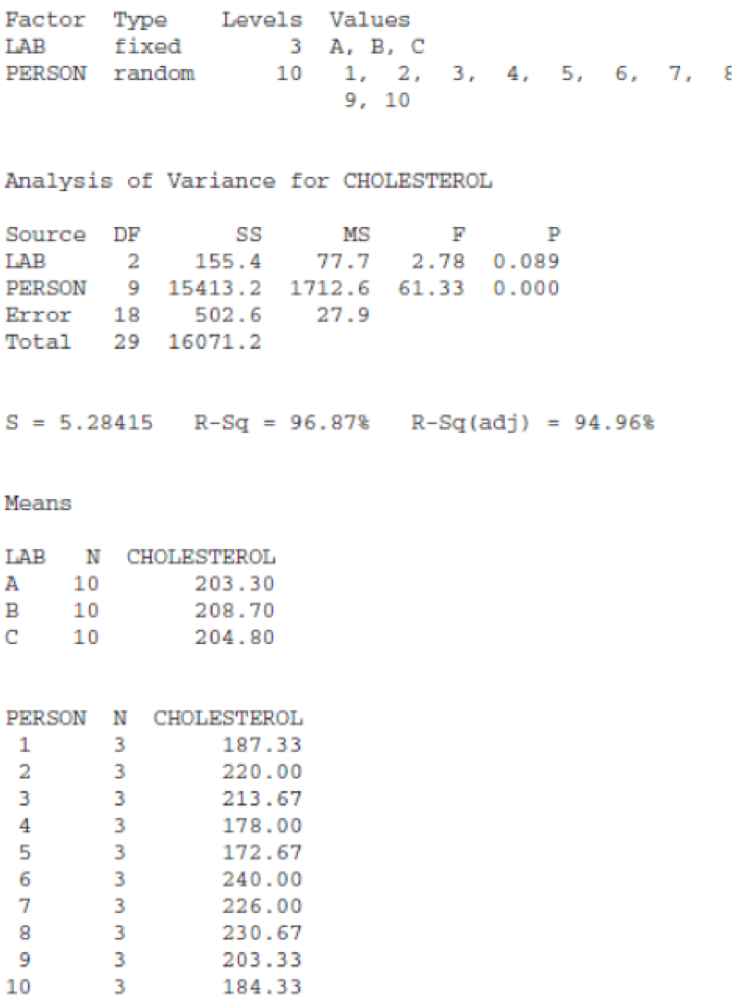
OUTPUT C.34
output for Exercise C.119
(and Exercise C.126)
ANOVA: CHOLESTEROL versus LAB, PERSON
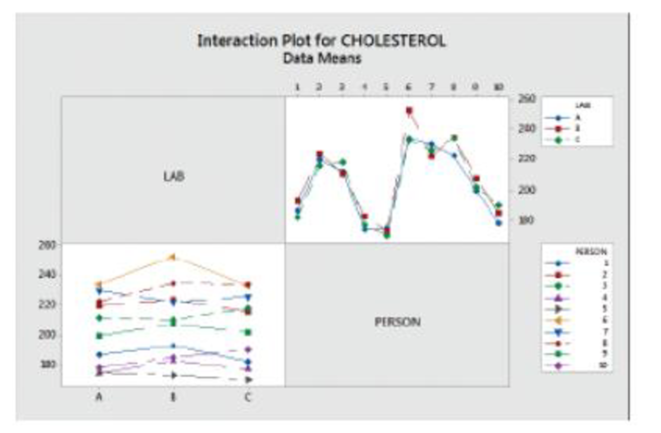
OUTPUT C. 35
output for Exercise C.119 (and Exercise C.126)
Want to see the full answer?
Check out a sample textbook solution
Chapter C Solutions
Introductory Statistics, Books a la Carte Plus NEW MyLab Statistics with Pearson eText -- Access Card Package (10th Edition)


- A company found that the daily sales revenue of its flagship product follows a normal distribution with a mean of $4500 and a standard deviation of $450. The company defines a "high-sales day" that is, any day with sales exceeding $4800. please provide a step by step on how to get the answers in excel Q: What percentage of days can the company expect to have "high-sales days" or sales greater than $4800? Q: What is the sales revenue threshold for the bottom 10% of days? (please note that 10% refers to the probability/area under bell curve towards the lower tail of bell curve) Provide answers in the yellow cellsarrow_forwardFind the critical value for a left-tailed test using the F distribution with a 0.025, degrees of freedom in the numerator=12, and degrees of freedom in the denominator = 50. A portion of the table of critical values of the F-distribution is provided. Click the icon to view the partial table of critical values of the F-distribution. What is the critical value? (Round to two decimal places as needed.)arrow_forwardA retail store manager claims that the average daily sales of the store are $1,500. You aim to test whether the actual average daily sales differ significantly from this claimed value. You can provide your answer by inserting a text box and the answer must include: Null hypothesis, Alternative hypothesis, Show answer (output table/summary table), and Conclusion based on the P value. Showing the calculation is a must. If calculation is missing,so please provide a step by step on the answers Numerical answers in the yellow cellsarrow_forward
 Glencoe Algebra 1, Student Edition, 9780079039897...AlgebraISBN:9780079039897Author:CarterPublisher:McGraw Hill
 College Algebra (MindTap Course List)AlgebraISBN:9781305652231Author:R. David Gustafson, Jeff HughesPublisher:Cengage Learning
 Holt Mcdougal Larson Pre-algebra: Student Edition...AlgebraISBN:9780547587776Author:HOLT MCDOUGALPublisher:HOLT MCDOUGAL