
Videos
In each of Exercises C.11–C.17 identify the following:
- a. the response, variable
- b. the factors
- c. the levels of each factor
- d. the number of treatment combinations
- e. the experimental units
- f. the number of observations for each treatment combination
- g. the experimental factors, if any
- h. the classification factors, if any
- i. whether the study is a designed experiment or an observational study
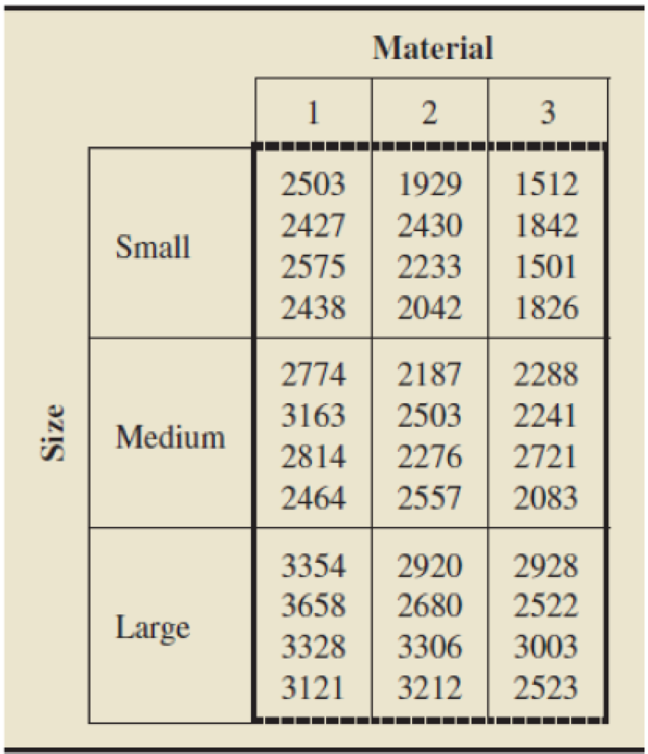
C.14 Highway Signs. A driver’s ability to detect highway signs is an important consideration in highway safety. In his dissertation Highway Construction Safety and the Aging Driver (1994), Solomon Younes investigated the distance at which drivers can first detect highway caution signs. This distance is called the detection distance. An experiment was conducted to determine the effects that sign size and sign material have on detection distance. Four drivers were randomly selected for each combination of sign size (small, medium, and large), and sign material (1, 2, and 3). Each driver covered the same stretch of highway at a constant speed during the same time of day, and the detection distance (in feet) was determined for the driver’s assigned caution sign. The data in the following table are based on the results of the experiment.
Want to see the full answer?
Check out a sample textbook solution
Chapter C Solutions
INTRO.STATISTICS,TECH.UPDT.-W/MYSTATLAB


- A company found that the daily sales revenue of its flagship product follows a normal distribution with a mean of $4500 and a standard deviation of $450. The company defines a "high-sales day" that is, any day with sales exceeding $4800. please provide a step by step on how to get the answers in excel Q: What percentage of days can the company expect to have "high-sales days" or sales greater than $4800? Q: What is the sales revenue threshold for the bottom 10% of days? (please note that 10% refers to the probability/area under bell curve towards the lower tail of bell curve) Provide answers in the yellow cellsarrow_forwardFind the critical value for a left-tailed test using the F distribution with a 0.025, degrees of freedom in the numerator=12, and degrees of freedom in the denominator = 50. A portion of the table of critical values of the F-distribution is provided. Click the icon to view the partial table of critical values of the F-distribution. What is the critical value? (Round to two decimal places as needed.)arrow_forwardA retail store manager claims that the average daily sales of the store are $1,500. You aim to test whether the actual average daily sales differ significantly from this claimed value. You can provide your answer by inserting a text box and the answer must include: Null hypothesis, Alternative hypothesis, Show answer (output table/summary table), and Conclusion based on the P value. Showing the calculation is a must. If calculation is missing,so please provide a step by step on the answers Numerical answers in the yellow cellsarrow_forward
 Glencoe Algebra 1, Student Edition, 9780079039897...AlgebraISBN:9780079039897Author:CarterPublisher:McGraw Hill
 Functions and Change: A Modeling Approach to Coll...AlgebraISBN:9781337111348Author:Bruce Crauder, Benny Evans, Alan NoellPublisher:Cengage Learning
 Big Ideas Math A Bridge To Success Algebra 1: Stu...AlgebraISBN:9781680331141Author:HOUGHTON MIFFLIN HARCOURTPublisher:Houghton Mifflin Harcourt