
Concept explainers
In the following exercises, you will explore some of your calculator's graphing capabilities. Answers are not given in the bath of the book.
Exploring the "Zoom Standard" command. Use your calculator to graph
|
|
• press
• select option 6 “Standard” or “ZStandard” by either: • using the down arrow to scroll down to that option and pressing • typing the number “6” |
| Casio | • press
• pres • press |
a. What is the result?
b. How else could you accomplish the same thing without using any zoom commands?
(a)
To find:
The result of the calculator to graph the line
Answer to Problem 1E
Solution:
The result of the calculator to graph the line
Explanation of Solution
Given:
The equation of the line,
Approach:
To graph the line
• Set the calculator up for instructions to graph by pressing
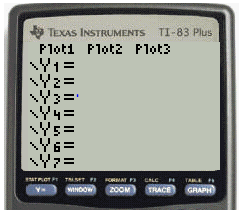
Figure
• To type the symbol
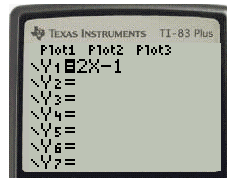
Figure
• Press the
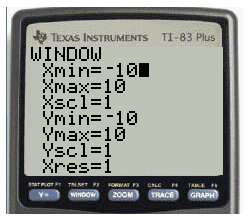
Figure
• Press the
Figure
• Now press the
• Select the “Zoom Standard” command from the “Zoom Menu”.
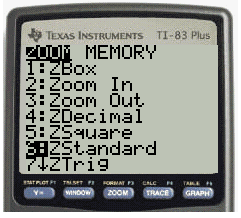
Figure
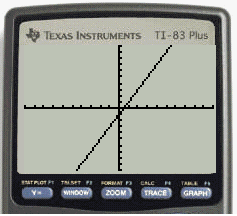
• Type number 6. The graph of the equation
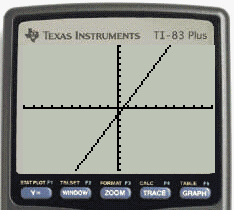
Figure
Therefore, the result of the calculator to graph the line
Conclusion:
Hence, the result of the calculator to graph the line
(b)
To find:
The alternate way to accomplish the same thing without using zoom command.
Answer to Problem 1E
Solution:
The same graph can be obtained by pressing the
Explanation of Solution
Calculation:
The same graph can be obtained by pressing the
Conclusion:
Hence, the same graph can be obtained by pressing the
Want to see more full solutions like this?
Chapter C Solutions
MATHEMATICS A PRACTICAL ODYSSEY W/ACCESS
Additional Math Textbook Solutions
Precalculus: Mathematics for Calculus (Standalone Book)
Finite Mathematics for Business, Economics, Life Sciences and Social Sciences
Elementary Statistics: Picturing the World (7th Edition)
Introductory Statistics
Algebra and Trigonometry (6th Edition)
Intermediate Algebra (13th Edition)
- No chatgpt pls will upvotearrow_forwardQ/By using Hart man theorem study the Stability of the critical points and draw the phase portrait of the system:- X = -4x+2xy - 8 y° = 4y² X2arrow_forwardThis means that when the Radius of Convergence of the Power Series is a "finite positive real number" r>0, then every point x of the Power Series on (-r, r) will absolutely converge (x ∈ (-r, r)). Moreover, every point x on the Power Series (-∞, -r)U(r, +∞) will diverge (|x| >r). Please explain it.arrow_forward
- Q1: A slider in a machine moves along a fixed straight rod. Its distance x cm along the rod is given below for various values of the time. Find the velocity and acceleration of the slider when t = 0.3 seconds. t(seconds) x(cm) 0 0.1 0.2 0.3 0.4 0.5 0.6 30.13 31.62 32.87 33.64 33.95 33.81 33.24 Q2: Using the Runge-Kutta method of fourth order, solve for y atr = 1.2, From dy_2xy +et = dx x²+xc* Take h=0.2. given x = 1, y = 0 Q3:Approximate the solution of the following equation using finite difference method. ly -(1-y= y = x), y(1) = 2 and y(3) = −1 On the interval (1≤x≤3).(taking h=0.5).arrow_forwardФ sketch stability x= -4x + 2xy - 8 y° = 4 y 2 - x² чуг.arrow_forward2 Q/Given H (x,y) = x² + y² - y² Find the Hamiltonian System and prove it is first integral-arrow_forward
- Q2) A: Find the region where ODEs has no limit cycle: x = y + x³ y=x+y+y³ 6arrow_forwardQ3)A: Given H(x,y)=x2-x+ y²as a first integral of an ODEs, find this ODES corresponding to H(x,y) and show the phase portrait by using Hartman theorem and by drawing graph of H(x,y)-e. Discuss the stability of critical points of the corresponding ODEs.arrow_forwardQ/ Write Example is First integral but not Conservation system.arrow_forward
- Algebra & Trigonometry with Analytic GeometryAlgebraISBN:9781133382119Author:SwokowskiPublisher:Cengage
 Algebra: Structure And Method, Book 1AlgebraISBN:9780395977224Author:Richard G. Brown, Mary P. Dolciani, Robert H. Sorgenfrey, William L. ColePublisher:McDougal Littell
 Holt Mcdougal Larson Pre-algebra: Student Edition...AlgebraISBN:9780547587776Author:HOLT MCDOUGALPublisher:HOLT MCDOUGAL
  Intermediate AlgebraAlgebraISBN:9781285195728Author:Jerome E. Kaufmann, Karen L. SchwittersPublisher:Cengage Learning
 Trigonometry (MindTap Course List)TrigonometryISBN:9781337278461Author:Ron LarsonPublisher:Cengage Learning


