Concept explainers
Videos
(a)
To show: The inequality
(a)
Explanation of Solution
Definition used:
The natural logarithmic function is the function defined by
If
Calculation:
The given inequality is
Here,
By using the above mentioned definition,
Use online graphing calculator, graph of the curve
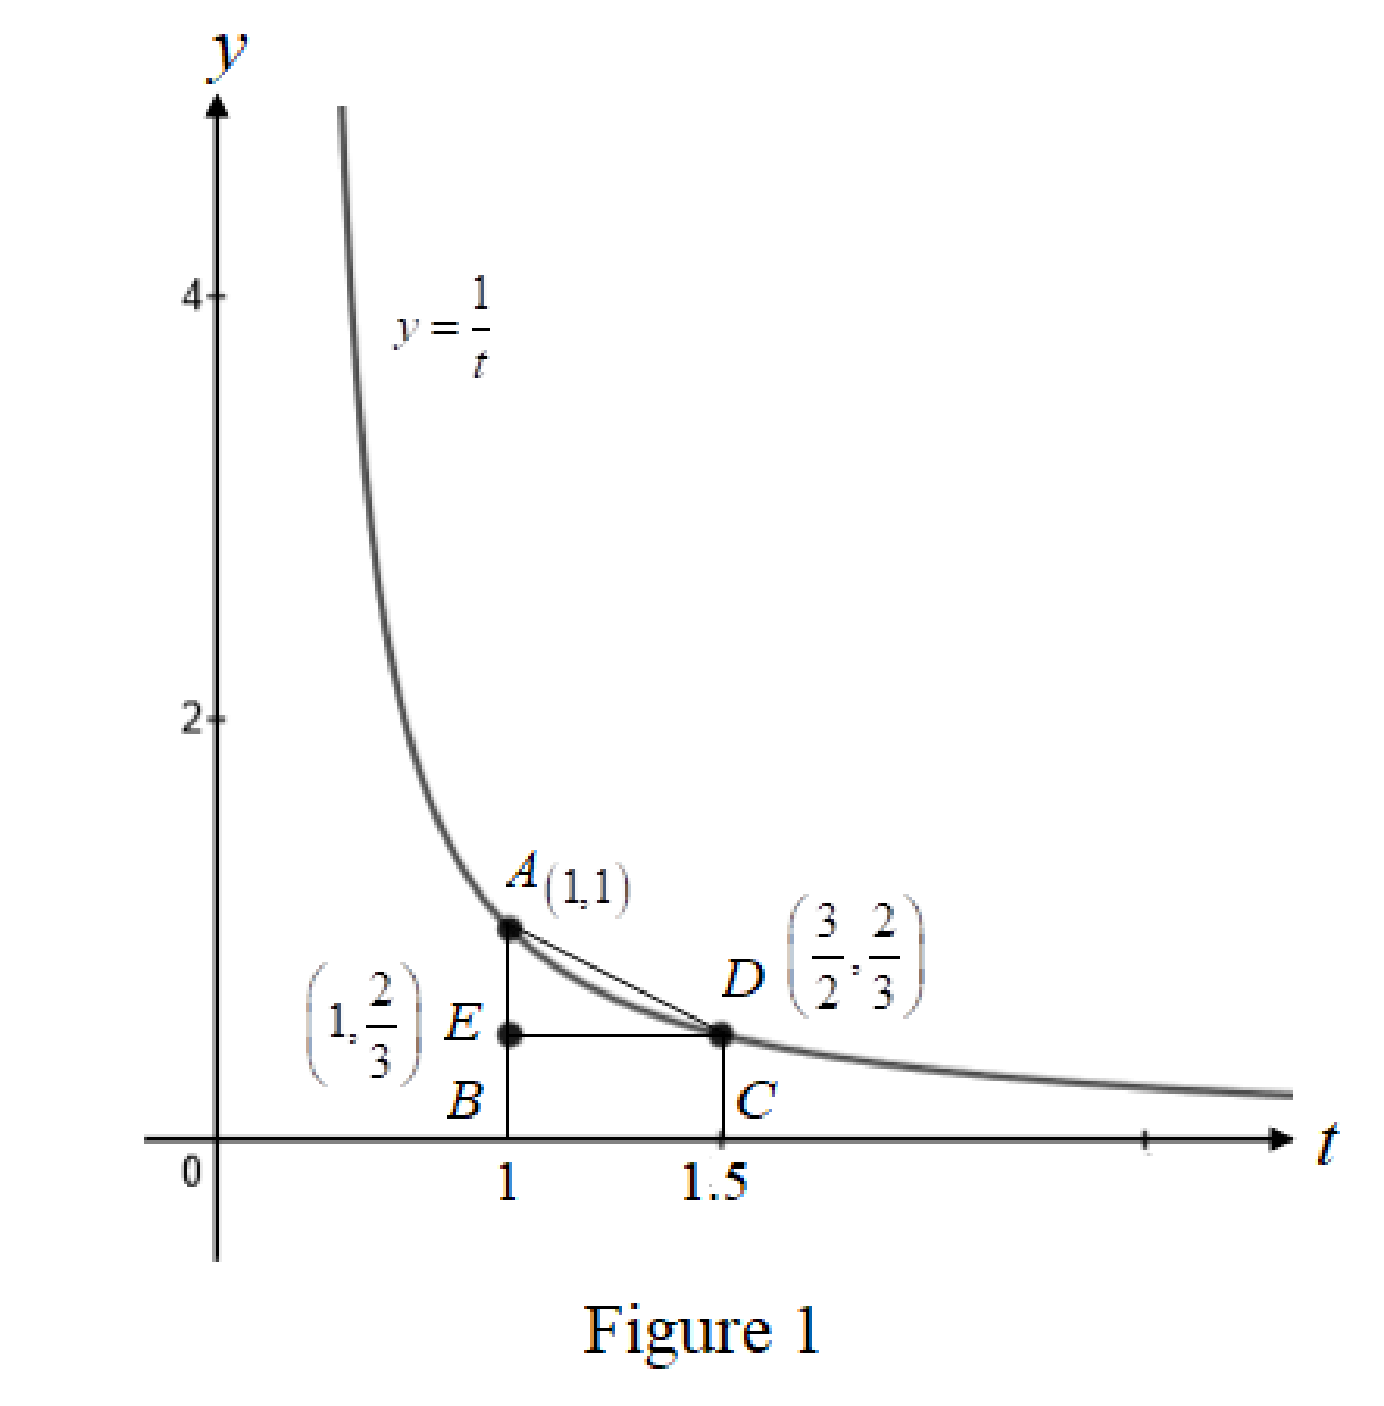
From Figure 1, it is observed that the area is larger than the area of rectangle BCDE and smaller than the area of trapezoid ABCD.
The area of the rectangle BCDE is calculated as follows.
The area of the trapezoid ABCD is calculated as follows.
It is known that the value of
The decimal value of the fraction
By comparing the above values with
Hence proved.
(b)
To show: The function
(b)
Answer to Problem 1E
The estimated value of
Explanation of Solution
Definition used:
Midpoint Rule:
Midpoint rule can be defined as
Where,
Natural logarithmic:
The natural logarithmic function is the function defined by
Calculation:
It is known that the equation of the curve is
Here,
From definition of natural logarithmic, the function
Here,
Find
Estimate the value of
Further simplification,
Therefore, the estimated value of
Want to see more full solutions like this?
Chapter C Solutions
Single Variable Essential Calculus: Early Transcendentals


- Consider the region below f(x) = (11-x), above the x-axis, and between x = 0 and x = 11. Let x; be the midpoint of the ith subinterval. Complete parts a. and b. below. a. Approximate the area of the region using eleven rectangles. Use the midpoints of each subinterval for the heights of the rectangles. The area is approximately square units. (Type an integer or decimal.)arrow_forwardRama/Shutterstock.com Romaset/Shutterstock.com The power station has three different hydroelectric turbines, each with a known (and unique) power function that gives the amount of electric power generated as a function of the water flow arriving at the turbine. The incoming water can be apportioned in different volumes to each turbine, so the goal of this project is to determine how to distribute water among the turbines to give the maximum total energy production for any rate of flow. Using experimental evidence and Bernoulli's equation, the following quadratic models were determined for the power output of each turbine, along with the allowable flows of operation: 6 KW₁ = (-18.89 +0.1277Q1-4.08.10 Q) (170 - 1.6 · 10¯*Q) KW2 = (-24.51 +0.1358Q2-4.69-10 Q¹²) (170 — 1.6 · 10¯*Q) KW3 = (-27.02 +0.1380Q3 -3.84-10-5Q) (170 - 1.6-10-ºQ) where 250 Q1 <1110, 250 Q2 <1110, 250 <3 < 1225 Qi = flow through turbine i in cubic feet per second KW = power generated by turbine i in kilowattsarrow_forwardHello! Please solve this practice problem step by step thanks!arrow_forward
- Hello, I would like step by step solution on this practive problem please and thanks!arrow_forwardHello! Please Solve this Practice Problem Step by Step thanks!arrow_forwarduestion 10 of 12 A Your answer is incorrect. L 0/1 E This problem concerns hybrid cars such as the Toyota Prius that are powered by a gas-engine, electric-motor combination, but can also function in Electric-Vehicle (EV) only mode. The figure below shows the velocity, v, of a 2010 Prius Plug-in Hybrid Prototype operating in normal hybrid mode and EV-only mode, respectively, while accelerating from a stoplight. 1 80 (mph) Normal hybrid- 40 EV-only t (sec) 5 15 25 Assume two identical cars, one running in normal hybrid mode and one running in EV-only mode, accelerate together in a straight path from a stoplight. Approximately how far apart are the cars after 15 seconds? Round your answer to the nearest integer. The cars are 1 feet apart after 15 seconds. Q Search M 34 mlp CHarrow_forward
- Find the volume of the region under the surface z = xy² and above the area bounded by x = y² and x-2y= 8. Round your answer to four decimal places.arrow_forwardУ Suppose that f(x, y) = · at which {(x, y) | 0≤ x ≤ 2,-x≤ y ≤√x}. 1+x D Q Then the double integral of f(x, y) over D is || | f(x, y)dxdy = | Round your answer to four decimal places.arrow_forwardD The region D above can be describe in two ways. 1. If we visualize the region having "top" and "bottom" boundaries, express each as functions of and provide the interval of x-values that covers the entire region. "top" boundary 92(x) = | "bottom" boundary 91(x) = interval of values that covers the region = 2. If we visualize the region having "right" and "left" boundaries, express each as functions of y and provide the interval of y-values that covers the entire region. "right" boundary f2(y) = | "left" boundary fi(y) =| interval of y values that covers the region =arrow_forward
- Find the volume of the region under the surface z = corners (0,0,0), (2,0,0) and (0,5, 0). Round your answer to one decimal place. 5x5 and above the triangle in the xy-plane witharrow_forwardGiven y = 4x and y = x² +3, describe the region for Type I and Type II. Type I 8. y + 2 -24 -1 1 2 2.5 X Type II N 1.5- x 1- 0.5 -0.5 -1 1 m y -2> 3 10arrow_forwardGiven D = {(x, y) | O≤x≤2, ½ ≤y≤1 } and f(x, y) = xy then evaluate f(x, y)d using the Type II technique. 1.2 1.0 0.8 y 0.6 0.4 0.2 0- -0.2 0 0.5 1 1.5 2 X X This plot is an example of the function over region D. The region identified in your problem will be slightly different. y upper integration limit Integral Valuearrow_forward
 Trigonometry (MindTap Course List)TrigonometryISBN:9781337278461Author:Ron LarsonPublisher:Cengage Learning

 Algebra & Trigonometry with Analytic GeometryAlgebraISBN:9781133382119Author:SwokowskiPublisher:Cengage
 College Algebra (MindTap Course List)AlgebraISBN:9781305652231Author:R. David Gustafson, Jeff HughesPublisher:Cengage Learning
 Functions and Change: A Modeling Approach to Coll...AlgebraISBN:9781337111348Author:Bruce Crauder, Benny Evans, Alan NoellPublisher:Cengage Learning