
Elementary Technical Mathematics
12th Edition
ISBN: 9781337630580
Author: Dale Ewen
Publisher: Cengage Learning
expand_more
expand_more
format_list_bulleted
Videos
Question
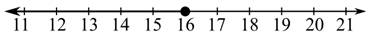
Chapter B, Problem 23E
To determine
The inequality from the graph given below,
Expert Solution & Answer
Want to see the full answer?
Check out a sample textbook solution
Students have asked these similar questions
Find the probability in tossing a fair coin three times, there will appear
a) 3 H b)2 H 1T c) 2 T and 1 H d) 3 T.
Let the random variable X represents the number of automobiles that
are used for different business purpose on any given workday.
Xi
p(xi)
1
0.3
Find: a) μx b)X2 c) o
2
2
3
0.4
0.3
please show all the work
Chapter B Solutions
Elementary Technical Mathematics
Ch. B - Draw a graph for each inequality on the number...Ch. B - Prob. 2ECh. B - Prob. 3ECh. B - Prob. 4ECh. B - Prob. 5ECh. B - Prob. 6ECh. B - Prob. 7ECh. B - Prob. 8ECh. B - Prob. 9ECh. B - Prob. 10E
Ch. B - Prob. 11ECh. B - Prob. 12ECh. B - Prob. 13ECh. B - Prob. 14ECh. B - Prob. 15ECh. B - Prob. 16ECh. B - Prob. 17ECh. B - Prob. 18ECh. B - Prob. 19ECh. B - Prob. 20ECh. B - Prob. 21ECh. B - Prob. 22ECh. B - Prob. 23ECh. B - Prob. 24ECh. B - Prob. 25ECh. B - Prob. 26ECh. B - Prob. 27ECh. B - Prob. 28ECh. B - Prob. 29ECh. B - Prob. 30ECh. B - Solve each inequality and graph its solution on...Ch. B - Prob. 32ECh. B - Prob. 33ECh. B - Prob. 34ECh. B - Prob. 35ECh. B - Prob. 36ECh. B - Prob. 37ECh. B - Prob. 38ECh. B - Prob. 39ECh. B - Prob. 40ECh. B - Prob. 41ECh. B - Prob. 42ECh. B - Prob. 43ECh. B - Prob. 44ECh. B - Solve each inequality and graph its solution on...Ch. B - Prob. 46ECh. B - Prob. 47ECh. B - Solve each inequality and graph its solution on...
Knowledge Booster


Learn more about
Need a deep-dive on the concept behind this application? Look no further. Learn more about this topic, subject and related others by exploring similar questions and additional content below.Similar questions
- please show all the workarrow_forwardQuestions An insurance company's cumulative incurred claims for the last 5 accident years are given in the following table: Development Year Accident Year 0 2018 1 2 3 4 245 267 274 289 292 2019 255 276 288 294 2020 265 283 292 2021 263 278 2022 271 It can be assumed that claims are fully run off after 4 years. The premiums received for each year are: Accident Year Premium 2018 306 2019 312 2020 318 2021 326 2022 330 You do not need to make any allowance for inflation. 1. (a) Calculate the reserve at the end of 2022 using the basic chain ladder method. (b) Calculate the reserve at the end of 2022 using the Bornhuetter-Ferguson method. 2. Comment on the differences in the reserves produced by the methods in Part 1.arrow_forwardplease show all the workarrow_forward
- please show all the workarrow_forwardQuestions An insurance company's cumulative incurred claims for the last 5 accident years are given in the following table: Development Year Accident Year 0 2018 1 2 3 4 245 267 274 289 292 2019 255 276 288 294 2020 265 283 292 2021 263 278 2022 271 It can be assumed that claims are fully run off after 4 years. The premiums received for each year are: Accident Year Premium 2018 306 2019 312 2020 318 2021 326 2022 330 You do not need to make any allowance for inflation. 1. (a) Calculate the reserve at the end of 2022 using the basic chain ladder method. (b) Calculate the reserve at the end of 2022 using the Bornhuetter-Ferguson method. 2. Comment on the differences in the reserves produced by the methods in Part 1.arrow_forwardA population that is uniformly distributed between a=0and b=10 is given in sample sizes 50( ), 100( ), 250( ), and 500( ). Find the sample mean and the sample standard deviations for the given data. Compare your results to the average of means for a sample of size 10, and use the empirical rules to analyze the sampling error. For each sample, also find the standard error of the mean using formula given below. Standard Error of the Mean =sigma/Root Complete the following table with the results from the sampling experiment. (Round to four decimal places as needed.) Sample Size Average of 8 Sample Means Standard Deviation of 8 Sample Means Standard Error 50 100 250 500arrow_forward
- survey of 5050 young professionals found that they spent an average of $20.5620.56 when dining out, with a standard deviation of $11.4111.41. Can you conclude statistically that the population mean is greater than $2323? Use a 95% confidence interval. Question content area bottom Part 1 The 95% confidence interval is left bracket nothing comma nothing right bracketenter your response here, enter your response here. As $2323 is ▼ of the confidence interval, we ▼ can cannot conclude that the population mean is greater than $2323. (Use ascending order. Round to four decimal places as needed.)arrow_forward1. vector projection. Assume, ER1001 and you know the following: ||||=4, 7=-0.5.7. For each of the following, explicitly compute the value. འབ (a) (b) (c) (d) answer. Explicitly compute ||y7||. Explain your answer. Explicitly compute the cosine similarity of and y. Explain your Explicitly compute (x, y). Explain your answer. Find the projection of onto y and the projection of onto .arrow_forwardA survey of 250250 young professionals found that two dash thirdstwo-thirds of them use their cell phones primarily for e-mail. Can you conclude statistically that the population proportion who use cell phones primarily for e-mail is less than 0.720.72? Use a 95% confidence interval. Question content area bottom Part 1 The 95% confidence interval is left bracket nothing comma nothing right bracket0.60820.6082, 0.72510.7251. As 0.720.72 is within the limits of the confidence interval, we cannot conclude that the population proportion is less than 0.720.72. (Use ascending order. Round to four decimal places as needed.)arrow_forward
arrow_back_ios
SEE MORE QUESTIONS
arrow_forward_ios
Recommended textbooks for you
 Glencoe Algebra 1, Student Edition, 9780079039897...AlgebraISBN:9780079039897Author:CarterPublisher:McGraw Hill
 Algebra: Structure And Method, Book 1AlgebraISBN:9780395977224Author:Richard G. Brown, Mary P. Dolciani, Robert H. Sorgenfrey, William L. ColePublisher:McDougal Littell
 Holt Mcdougal Larson Pre-algebra: Student Edition...AlgebraISBN:9780547587776Author:HOLT MCDOUGALPublisher:HOLT MCDOUGAL
 College Algebra (MindTap Course List)AlgebraISBN:9781305652231Author:R. David Gustafson, Jeff HughesPublisher:Cengage Learning
 Big Ideas Math A Bridge To Success Algebra 1: Stu...AlgebraISBN:9781680331141Author:HOUGHTON MIFFLIN HARCOURTPublisher:Houghton Mifflin Harcourt
 Elementary AlgebraAlgebraISBN:9780998625713Author:Lynn Marecek, MaryAnne Anthony-SmithPublisher:OpenStax - Rice University
Glencoe Algebra 1, Student Edition, 9780079039897...
Algebra
ISBN:9780079039897
Author:Carter
Publisher:McGraw Hill
Algebra: Structure And Method, Book 1
Algebra
ISBN:9780395977224
Author:Richard G. Brown, Mary P. Dolciani, Robert H. Sorgenfrey, William L. Cole
Publisher:McDougal Littell
Holt Mcdougal Larson Pre-algebra: Student Edition...
Algebra
ISBN:9780547587776
Author:HOLT MCDOUGAL
Publisher:HOLT MCDOUGAL
College Algebra (MindTap Course List)
Algebra
ISBN:9781305652231
Author:R. David Gustafson, Jeff Hughes
Publisher:Cengage Learning
Big Ideas Math A Bridge To Success Algebra 1: Stu...
Algebra
ISBN:9781680331141
Author:HOUGHTON MIFFLIN HARCOURT
Publisher:Houghton Mifflin Harcourt
Elementary Algebra
Algebra
ISBN:9780998625713
Author:Lynn Marecek, MaryAnne Anthony-Smith
Publisher:OpenStax - Rice University
2.1 Introduction to inequalities; Author: Oli Notes;https://www.youtube.com/watch?v=D6erN5YTlXE;License: Standard YouTube License, CC-BY
GCSE Maths - What are Inequalities? (Inequalities Part 1) #56; Author: Cognito;https://www.youtube.com/watch?v=e_tY6X5PwWw;License: Standard YouTube License, CC-BY
Introduction to Inequalities | Inequality Symbols | Testing Solutions for Inequalities; Author: Scam Squad Math;https://www.youtube.com/watch?v=paZSN7sV1R8;License: Standard YouTube License, CC-BY