
Concept explainers
Videos
OUTPUT B.95 Output for Problem 10
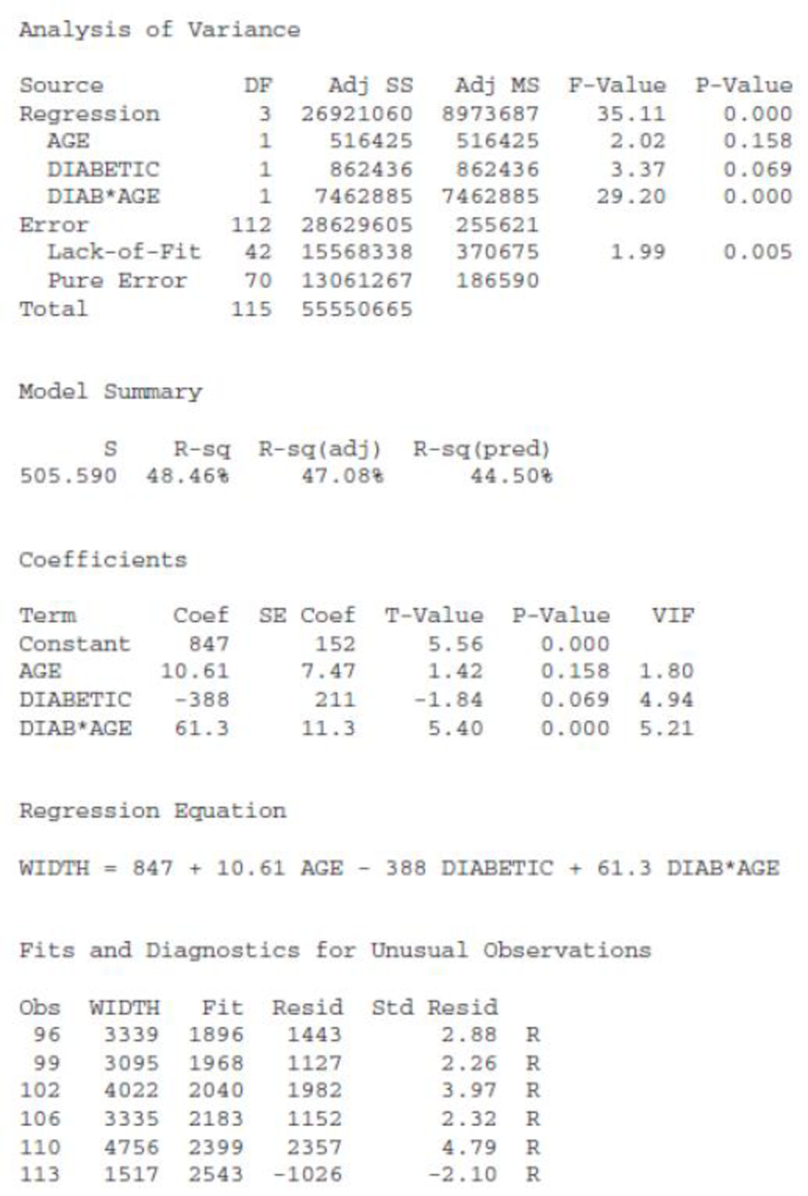
R Large residual
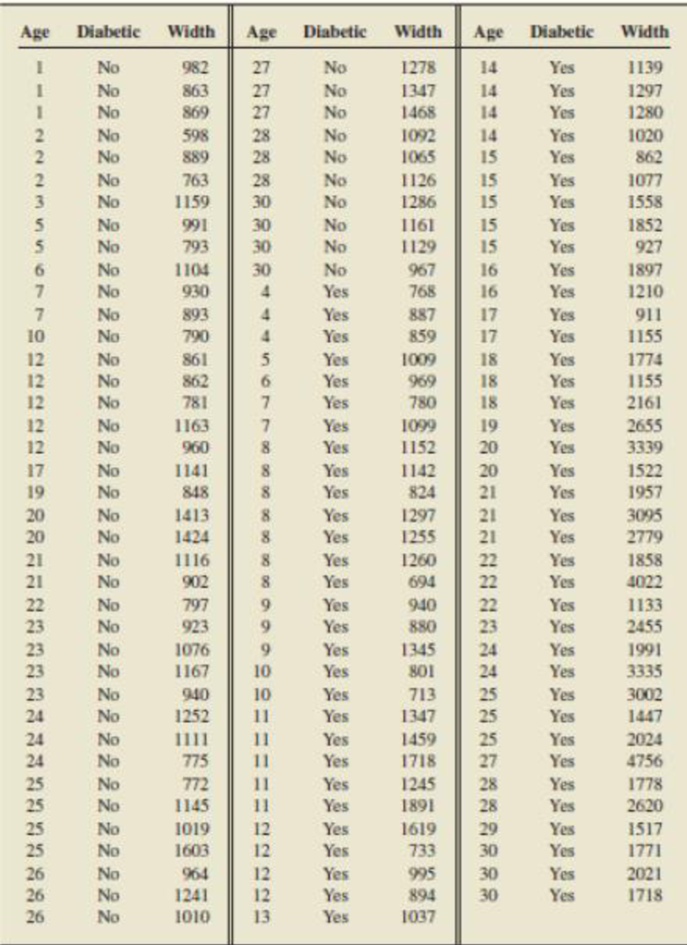
10. Diabetes. In the research article “Capillary Basement Membrane Width in Diabetic Children" (American Journal of Medicine, 58. pp. 365–372), P. Raskin et al. obtained data on age and on width of the quadriceps muscle capillary basement membrane of individuals with and without diabetes. The membrane width can be used to diagnose the presence of diabetic microangiopathy. The table below provides the data obtained by the researchers. We want to predict membrane width based on age and whether the person is a diabetic. We introduce the indicator variable diabetic defined by
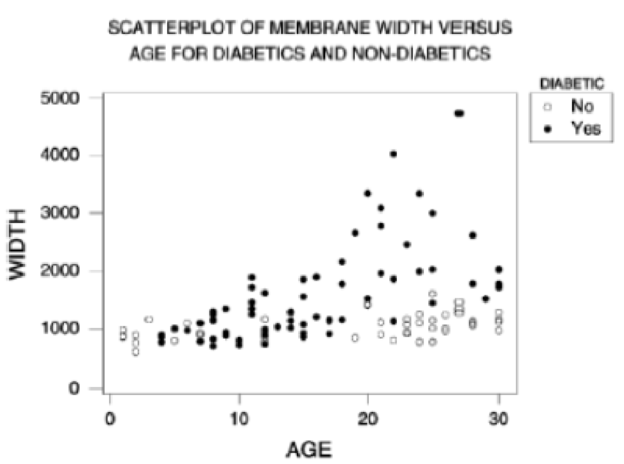
- a. Output B .91 on page B-170 shows a plot of width versus age, with the plot symbol being a solid black circle for diabetics and an open circle for non-diabetics. Based on this plot does it appear that diabetic is a useful predictor variable? Explain your answer.
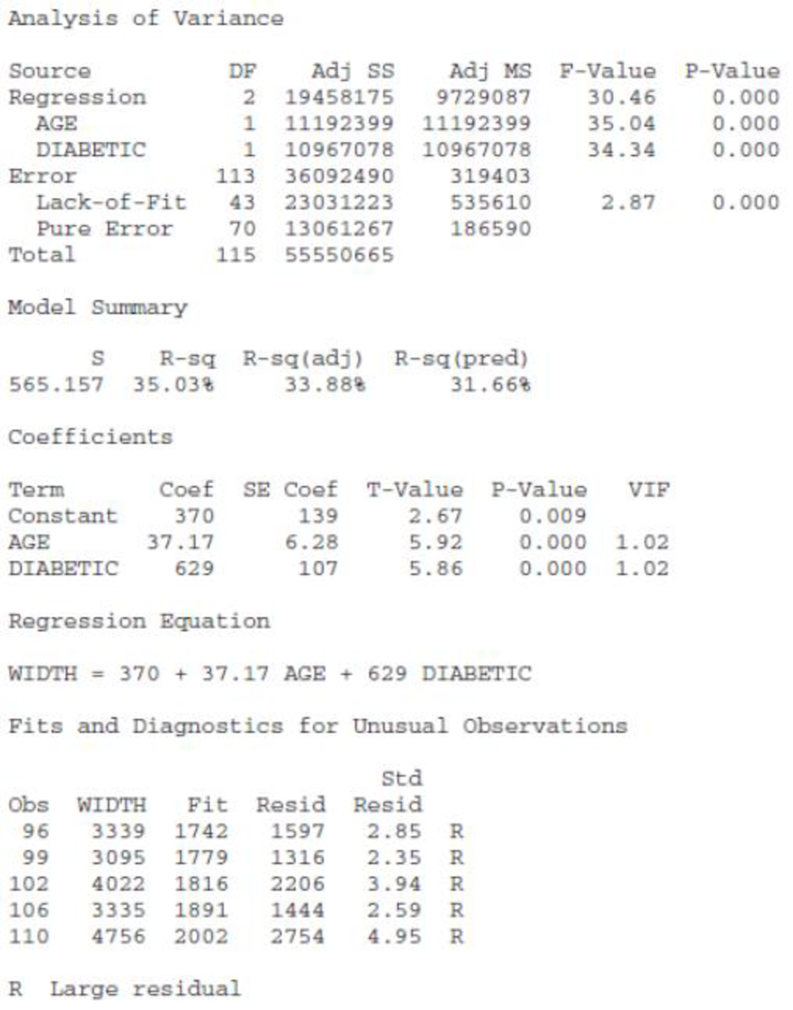
- b. We obtained the regression analysis of width on age and diabetic shown in Output B.92 on page B-170. Conduct the t-tests for the individual utility of each of the two predictor variables. Use a 5% level of significance and interpret your results.
- c. Based on Output B.92, obtain the regression equations relating width to age for diabetics and non-diabetics, separately.
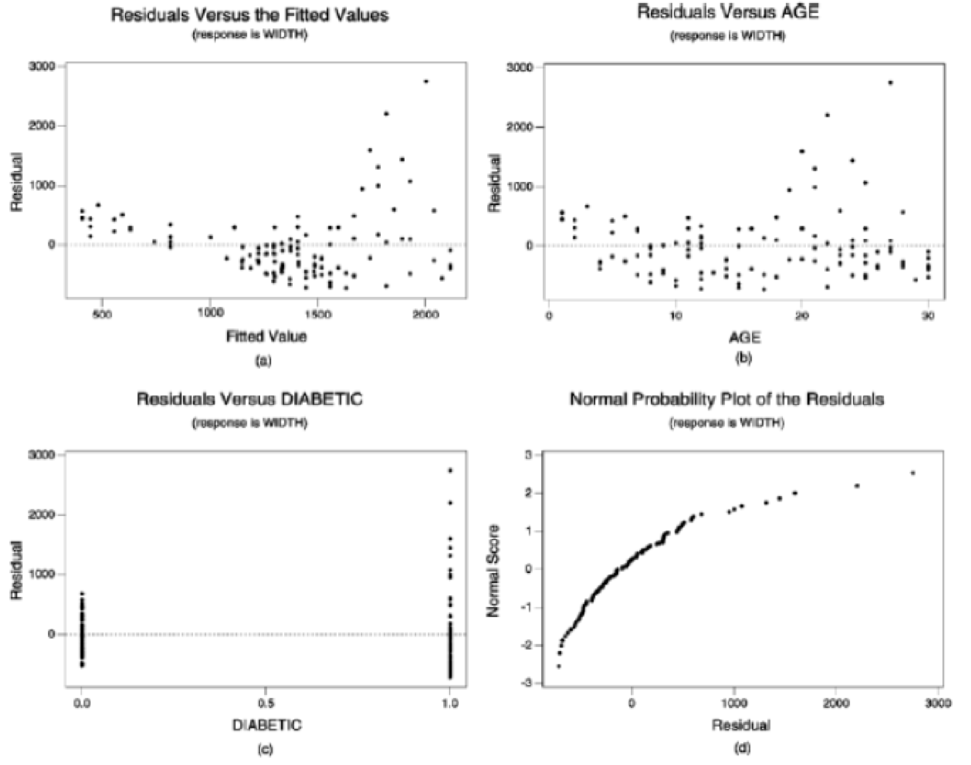
- d. Outputs B.93(a), (b), (c), and (d), given on page B-171, provide, respectively, plots of residuals versus fitted values, residuals versus age, residuals versus diabetic, and a normal probability plot of the residuals. Perform a residual analysis to assess the appropriateness of the regression equation, constancy of the conditional standard deviations, and normality of the conditional distributions. Check for outliers and influential observations.
Table for Problem 10
OUTPUT B.91
OUTPUT B.92 Output for Problem 10
Regression Analysis: WIDTH versus AGE, DIABETIC
OUTPUT B.93 Residual plots for Problem 10
- e. Output B.94 provides a plot of width versus age with regression lines for diabetics and non-diabetics. Based on this output and your residual analysis in part (d), do you feel that the model fits the data well? Explain your answer.
- f. To check for interaction between the two predictor variables, we obtained the regression analysis of width on age, diabetic, and diabetic-age. The output is given in Output B.95 on page B-172. Is there an interaction between age and diabetic? Use α = 0.05.
- g. What other analyses should be performed on these data? Explain your answer.
Want to see the full answer?
Check out a sample textbook solution
Chapter B Solutions
INTRO.STATISTICS,TECH.UPDT.-W/MYSTATLAB


- Name Harvard University California Institute of Technology Massachusetts Institute of Technology Stanford University Princeton University University of Cambridge University of Oxford University of California, Berkeley Imperial College London Yale University University of California, Los Angeles University of Chicago Johns Hopkins University Cornell University ETH Zurich University of Michigan University of Toronto Columbia University University of Pennsylvania Carnegie Mellon University University of Hong Kong University College London University of Washington Duke University Northwestern University University of Tokyo Georgia Institute of Technology Pohang University of Science and Technology University of California, Santa Barbara University of British Columbia University of North Carolina at Chapel Hill University of California, San Diego University of Illinois at Urbana-Champaign National University of Singapore…arrow_forwardA company found that the daily sales revenue of its flagship product follows a normal distribution with a mean of $4500 and a standard deviation of $450. The company defines a "high-sales day" that is, any day with sales exceeding $4800. please provide a step by step on how to get the answers in excel Q: What percentage of days can the company expect to have "high-sales days" or sales greater than $4800? Q: What is the sales revenue threshold for the bottom 10% of days? (please note that 10% refers to the probability/area under bell curve towards the lower tail of bell curve) Provide answers in the yellow cellsarrow_forwardFind the critical value for a left-tailed test using the F distribution with a 0.025, degrees of freedom in the numerator=12, and degrees of freedom in the denominator = 50. A portion of the table of critical values of the F-distribution is provided. Click the icon to view the partial table of critical values of the F-distribution. What is the critical value? (Round to two decimal places as needed.)arrow_forward
- A retail store manager claims that the average daily sales of the store are $1,500. You aim to test whether the actual average daily sales differ significantly from this claimed value. You can provide your answer by inserting a text box and the answer must include: Null hypothesis, Alternative hypothesis, Show answer (output table/summary table), and Conclusion based on the P value. Showing the calculation is a must. If calculation is missing,so please provide a step by step on the answers Numerical answers in the yellow cellsarrow_forwardShow all workarrow_forwardShow all workarrow_forward
 Big Ideas Math A Bridge To Success Algebra 1: Stu...AlgebraISBN:9781680331141Author:HOUGHTON MIFFLIN HARCOURTPublisher:Houghton Mifflin Harcourt
 Linear Algebra: A Modern IntroductionAlgebraISBN:9781285463247Author:David PoolePublisher:Cengage Learning
 Elementary Linear Algebra (MindTap Course List)AlgebraISBN:9781305658004Author:Ron LarsonPublisher:Cengage Learning