EBK BUSINESS ANALYTICS
3rd Edition
ISBN: 9780135231906
Author: Evans
Publisher: VST
expand_more
expand_more
format_list_bulleted
Concept explainers
Videos
Textbook Question
Chapter A4, Problem 2PE
Construct histograms using the Histogram chart for the gross sales and gross profit data in the Excel file Sales Data.
Expert Solution & Answer
To determine
To construct histogram for gross sales and gross profit.
Explanation of Solution
Given:
The data contains Customer, Percent gross, gross sales, gross profit, Industry code and competitive rating.
Following is the process to construct histogram for gross sales:
First select column of gross sales then click on
Insert→Charts→Histogram
Histogram for gross sales is:
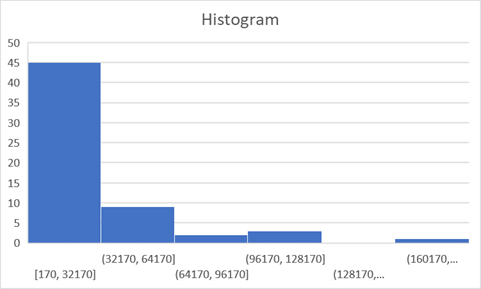
The shape of the distribution of data is right skewed.
Following is the histogram for gross profit:
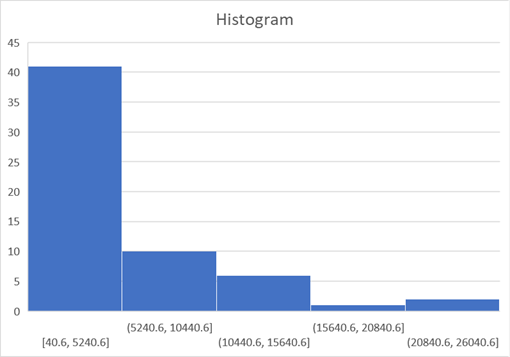
The shape of the distribution of data is right skewed.
Want to see more full solutions like this?
Subscribe now to access step-by-step solutions to millions of textbook problems written by subject matter experts!
Students have asked these similar questions
Need Answer
Can you solve this financial accounting question with the appropriate financial analysis techniques?
Financial accounting
Chapter A4 Solutions
EBK BUSINESS ANALYTICS
Knowledge Booster


Learn more about
Need a deep-dive on the concept behind this application? Look no further. Learn more about this topic, subject and related others by exploring similar questions and additional content below.Similar questions
- Ovid Holdings acquired Twilight Enterprises on January 1, 2019 for $8,200,000, and recorded goodwill of $1,500,000 as a result of that purchase. At December 31, 2019, the Twilight Enterprises Division had a fair value of $7,300,000. The net identifiable assets of the Division (excluding goodwill) had a fair value of $6,400,000 at that time. What amount of loss on impairment of goodwill should Ovid Holdings record in 2019? a) $0 b) $600,000 c) $900,000 d) $1,500,000arrow_forwardI need assistance with this general accounting question using appropriate principles.arrow_forwardThe beginning inventory?arrow_forward
- What is the cost of goods sold for yaghan enterprises?arrow_forwardPlease provide the solution to this general accounting question using proper accounting principles.arrow_forwardThis was the question asked of Jack Otto, production supervisor, by one of his manufacturing workers, Clyde Fisher. Jack had been wondering the same thing for several weeks about Bob Hill, another of his welders. Jack Otto is a 54-year-old production supervisor who has been with Store Fixture Manufacturing Co. (SFM) for 20 years. He is well liked and respected by his peers and subordinates and is very competent at the technical aspects of his supervisory job. Bob Hill, 40 years old, has been a generally competent and productive welder at SFM for ten years. Bob has been popular with his coworkers. Although he periodically "blows up" at them, he always apologizes afterward. His absenteeism rate has been higher than average for the last several years, with most absenteeism on Mondays. Also, it is not uncommon for Bob to be 10–15 minutes late at least once a week. But, because of a shortage of experienced welders and because Bob often cuts his lunch hour short to make up his tardiness…arrow_forward
arrow_back_ios
SEE MORE QUESTIONS
arrow_forward_ios
Recommended textbooks for you
 Practical Management ScienceOperations ManagementISBN:9781337406659Author:WINSTON, Wayne L.Publisher:Cengage,
 MarketingMarketingISBN:9780357033791Author:Pride, William MPublisher:South Western Educational Publishing
 Contemporary MarketingMarketingISBN:9780357033777Author:Louis E. Boone, David L. KurtzPublisher:Cengage Learning
 Foundations of Business (MindTap Course List)MarketingISBN:9781337386920Author:William M. Pride, Robert J. Hughes, Jack R. KapoorPublisher:Cengage Learning
Practical Management Science
Operations Management
ISBN:9781337406659
Author:WINSTON, Wayne L.
Publisher:Cengage,
Marketing
Marketing
ISBN:9780357033791
Author:Pride, William M
Publisher:South Western Educational Publishing
Contemporary Marketing
Marketing
ISBN:9780357033777
Author:Louis E. Boone, David L. Kurtz
Publisher:Cengage Learning
Foundations of Business (MindTap Course List)
Marketing
ISBN:9781337386920
Author:William M. Pride, Robert J. Hughes, Jack R. Kapoor
Publisher:Cengage Learning
Correlation Vs Regression: Difference Between them with definition & Comparison Chart; Author: Key Differences;https://www.youtube.com/watch?v=Ou2QGSJVd0U;License: Standard YouTube License, CC-BY
Correlation and Regression: Concepts with Illustrative examples; Author: LEARN & APPLY : Lean and Six Sigma;https://www.youtube.com/watch?v=xTpHD5WLuoA;License: Standard YouTube License, CC-BY