
Introductory Statistics, Books a la Carte Plus NEW MyLab Statistics with Pearson eText -- Access Card Package (10th Edition)
10th Edition
ISBN: 9780134270364
Author: Neil A. Weiss
Publisher: PEARSON
expand_more
expand_more
format_list_bulleted
Concept explainers
Videos
Textbook Question
Chapter A.2, Problem 41E
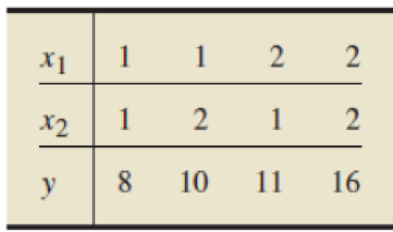
In each of Exercises A.41 and A.42,
- a. construct tables giving the values of x1, x2, y, ŷ, e = y – ŷ, and e2 similar to Table 14.4.
- b. determine which of the two planes fits the set of data points better according to the least squares criterion.
A.41 Plane A: y = 2 + 3x1 + x2
Plane B: y = 3 + 4x1 + 2x2
Expert Solution & Answer
Want to see the full answer?
Check out a sample textbook solution
Students have asked these similar questions
A retail store manager claims that the average daily sales of the store are $1,500.
You aim to test whether the actual average daily sales differ significantly from this claimed value.
You can provide your answer by inserting a text box and the answer must include:
Null hypothesis,
Alternative hypothesis,
Show answer (output table/summary table), and
Conclusion based on the P value.
Showing the calculation is a must. If calculation is missing,so please provide a step by step on the answers
Numerical answers in the yellow cells
Show all work
Show all work
Chapter A Solutions
Introductory Statistics, Books a la Carte Plus NEW MyLab Statistics with Pearson eText -- Access Card Package (10th Edition)
Ch. A.1 - A. 1 Regarding linear equations in two or more...Ch. A.1 - Fill in the blanks. a. The graph of a linear...Ch. A.1 - Consider a linear equation y = b0 + b1x1 + b2x2. ...Ch. A.1 - Prob. 4ECh. A.1 - Prob. 5ECh. A.1 - Prob. 6ECh. A.1 - Banquet Room Rental. The banquet room at the...Ch. A.1 - Prob. 8ECh. A.1 - In each of Exercises A.9A.12, a. determine the...Ch. A.1 - In each of Exercises A.9A.12, a. determine the...
Ch. A.1 - In each of Exercises A.9A.12, a. determine the...Ch. A.1 - In each of Exercises A.9A.12, a. determine the...Ch. A.1 - Prob. 13ECh. A.1 - Prob. 14ECh. A.1 - Prob. 15ECh. A.1 - In each of Exercises A.13A.22, you are given the...Ch. A.1 - Prob. 17ECh. A.1 - Prob. 18ECh. A.1 - In each of Exercises A.13A.22, you are given the...Ch. A.1 - Prob. 20ECh. A.1 - Prob. 21ECh. A.1 - In each of Exercises A.13A.22, you are given the...Ch. A.1 - In each of Exercises A.23A.30, we have identified...Ch. A.1 - Prob. 24ECh. A.1 - Prob. 25ECh. A.1 - Prob. 26ECh. A.1 - In each of Exercises A.23A.30, we have identified...Ch. A.1 - Prob. 28ECh. A.1 - Prob. 29ECh. A.1 - Prob. 30ECh. A.1 - Why is it often preferable to use more than one...Ch. A.1 - Grade Prediction. The Statistics Department at a...Ch. A.1 - Prob. 33ECh. A.1 - Blood Pressure Medication. A medical researcher...Ch. A.1 - Infant Mortality Rate. A social scientist wants to...Ch. A.2 - Regarding a scatterplot matrix: a. Identify two of...Ch. A.2 - Regarding the criterion used to decide tits a set...Ch. A.2 - Prob. 38ECh. A.2 - Regarding the variables in a multiple linear...Ch. A.2 - Answer true or false to the following statements...Ch. A.2 - In each of Exercises A.41 and A.42, a. construct...Ch. A.2 - In each of Exercises A.41 and A.42, a. construct...Ch. A.2 - Advertising and Sales. A household-appliance...Ch. A.2 - Corvette Prices. The data on age and price for 10...Ch. A.2 - Graduation Kales. Graduation rates and what...Ch. A.2 - Custom Home Resales. Hanna Properties specializes...Ch. A.2 - Advertising and Sales. Refer to Exercise A.43. Use...Ch. A.2 - Prob. 48ECh. A.2 - Graduation Rates. Refer to Exercise A.45. Use the...Ch. A.2 - Custom Home Resales. Refer to Exercise A.46. Use...Ch. A.3 - Fill in the blanks. a. A measure of total...Ch. A.3 - In this section we introduced a descriptive...Ch. A.3 - Suppose x1, x2, and x3 are predictor variables and...Ch. A.3 - State the four conditions required for making...Ch. A.3 - In each of Exercises A.55A.59, assume the...Ch. A.3 - In each of Exercises A.55A.59, assume the...Ch. A.3 - In each of Exercises A.55A.59, assume the...Ch. A.3 - Prob. 58ECh. A.3 - In each of Exercises A.55A.59, assume the...Ch. A.3 - Fill in the blanks. a. When a sum of squares is...Ch. A.3 - Answer true or false to the following statements...Ch. A.3 - For a particular multiple linear regression...Ch. A.3 - For a particular multiple linear regression...Ch. A.3 - Advertising and Sales. Refer to Exercise A.43 on...Ch. A.3 - Corvette Prices. Refer to Exercise A.44 on page...Ch. A.3 - Graduation Rates. Refer to Exercise A.45 on page...Ch. A.3 - Custom Home Resales. Refer to Exercise A.46 on...Ch. A.3 - Advertising and Sales. Refer to Exercise A.43 on...Ch. A.3 - Corvette Prices. Refer to Exercise A.44 on page...Ch. A.3 - Graduation Rates. Refer to Exercise A.45 on page...Ch. A.3 - Custom Home Resales. Refer to Exercise A.46 on...Ch. A.3 - Suppose that R2 = 1 for a data set. What can you...Ch. A.3 - Suppose that R2 = 0 for a data set. What can you...Ch. A.3 - Use the regression identity for multiple linear...Ch. A.4 - Explain why the predictor variables are useless as...Ch. A.4 - Prob. 76ECh. A.4 - What test statistic is used for a hypothesis test...Ch. A.4 - Answer line or false to the following statements...Ch. A.4 - Advertising and Sales. Refer to Exercise A.43 oil...Ch. A.4 - Prob. 80ECh. A.4 - Graduation Rates. Refer to Exercise A.45 on page...Ch. A.4 - Custom-Home Resales. Refer to Exercise A.46 on...Ch. A.4 - Advertising and Sales. Referring to Exercise A.79,...Ch. A.4 - Prob. 84ECh. A.4 - Graduation Rates. Referring to Exercise A.81, use...Ch. A.4 - Prob. 86ECh. A.5 - What two regression inferences did we discuss in...Ch. A.5 - Prob. 88ECh. A.5 - A sample multiple linear regression equation...Ch. A.5 - Answer true or false to the following statements...Ch. A.5 - Advertising and Sales. Refer to Exercise A.43 on...Ch. A.5 - Corvette Prices. Refer to Exercise A.44 on page...Ch. A.5 - Graduation Rates. Refer to Exercise A.45 on page...Ch. A.5 - Custom-Home Resales. Refer to Exercise A.46 on...Ch. A.5 - Advertising and Sales. Referring to Exercise A.91,...Ch. A.5 - Corvette Sales. Referring to Exercise A.92, use...Ch. A.5 - Graduation Rates. Referring to Exercise A.93, use...Ch. A.5 - Custom-Home Resales. Referring to Exercise A.94,...Ch. A.6 - Fill in the blanks. a. In multiple linear...Ch. A.6 - Describe the difference between a residual and a...Ch. A.6 - Fill in the blanks. a. In multiple linear...Ch. A.6 - Answer true or false to the following statements...Ch. A.6 - Prob. 103ECh. A.6 - Corvette Prices. Refer to Exercise A.44 on page...Ch. A.6 - Advertising and Sales. Refer to Exercise A.43 on...Ch. A.6 - Corvette Prices. Refer to Exercise A.44 on page...Ch. A.6 - Graduation Rates. Refer to Exercise A.45 on page...Ch. A.6 - Custom-Homes Resales. Refer to Exercise A.46 on...Ch. A - For a linear equation y = b0 + b1x1 + b2x2 + b3x3,...Ch. A - Consider the linear equation y = 5 + 4x1 3x2. a....Ch. A - Answer true or false to each of the following...Ch. A - What kind of plot is useful for deciding whether...Ch. A - Prob. 5RPCh. A - Prob. 6RPCh. A - Regarding multiple linear regression analysis: a....Ch. A - Prob. 8RPCh. A - For each of the following sums of squares in...Ch. A - Prob. 10RPCh. A - Prob. 11RPCh. A - Suppose x1 and x2 are predictor variables for a...Ch. A - Fill in the blanks. a. The F-statistic for a test...Ch. A - Answer true or false to each of the following...Ch. A - Which interval is wider: (a) the 95% confidence...Ch. A - What plots did we use in this module to decide...Ch. A - Regarding analysis of residuals, decide in each...Ch. A - Annual Income. The Census Bureau collects data on...Ch. A - Annual Income. Refer to Problem 18 and the...Ch. A - Annual Income. Refer to Problem 18, Outputs...Ch. A - Recall from Chapter 1 (page 34 of your text) that...Ch. A - At the beginning of this module on page A-0, we...
Knowledge Booster


Learn more about
Need a deep-dive on the concept behind this application? Look no further. Learn more about this topic, statistics and related others by exploring similar questions and additional content below.Similar questions
- please find the answers for the yellows boxes using the information and the picture belowarrow_forwardA marketing agency wants to determine whether different advertising platforms generate significantly different levels of customer engagement. The agency measures the average number of daily clicks on ads for three platforms: Social Media, Search Engines, and Email Campaigns. The agency collects data on daily clicks for each platform over a 10-day period and wants to test whether there is a statistically significant difference in the mean number of daily clicks among these platforms. Conduct ANOVA test. You can provide your answer by inserting a text box and the answer must include: also please provide a step by on getting the answers in excel Null hypothesis, Alternative hypothesis, Show answer (output table/summary table), and Conclusion based on the P value.arrow_forwardA company found that the daily sales revenue of its flagship product follows a normal distribution with a mean of $4500 and a standard deviation of $450. The company defines a "high-sales day" that is, any day with sales exceeding $4800. please provide a step by step on how to get the answers Q: What percentage of days can the company expect to have "high-sales days" or sales greater than $4800? Q: What is the sales revenue threshold for the bottom 10% of days? (please note that 10% refers to the probability/area under bell curve towards the lower tail of bell curve) Provide answers in the yellow cellsarrow_forward
- Business Discussarrow_forwardThe following data represent total ventilation measured in liters of air per minute per square meter of body area for two independent (and randomly chosen) samples. Analyze these data using the appropriate non-parametric hypothesis testarrow_forwardeach column represents before & after measurements on the same individual. Analyze with the appropriate non-parametric hypothesis test for a paired design.arrow_forward
arrow_back_ios
SEE MORE QUESTIONS
arrow_forward_ios
Recommended textbooks for you
 Linear Algebra: A Modern IntroductionAlgebraISBN:9781285463247Author:David PoolePublisher:Cengage Learning
 Elementary Linear Algebra (MindTap Course List)AlgebraISBN:9781305658004Author:Ron LarsonPublisher:Cengage Learning
 Algebra & Trigonometry with Analytic GeometryAlgebraISBN:9781133382119Author:SwokowskiPublisher:Cengage
 Algebra: Structure And Method, Book 1AlgebraISBN:9780395977224Author:Richard G. Brown, Mary P. Dolciani, Robert H. Sorgenfrey, William L. ColePublisher:McDougal Littell
Linear Algebra: A Modern Introduction
Algebra
ISBN:9781285463247
Author:David Poole
Publisher:Cengage Learning
Elementary Linear Algebra (MindTap Course List)
Algebra
ISBN:9781305658004
Author:Ron Larson
Publisher:Cengage Learning
Algebra & Trigonometry with Analytic Geometry
Algebra
ISBN:9781133382119
Author:Swokowski
Publisher:Cengage
Algebra: Structure And Method, Book 1
Algebra
ISBN:9780395977224
Author:Richard G. Brown, Mary P. Dolciani, Robert H. Sorgenfrey, William L. Cole
Publisher:McDougal Littell
Correlation Vs Regression: Difference Between them with definition & Comparison Chart; Author: Key Differences;https://www.youtube.com/watch?v=Ou2QGSJVd0U;License: Standard YouTube License, CC-BY
Correlation and Regression: Concepts with Illustrative examples; Author: LEARN & APPLY : Lean and Six Sigma;https://www.youtube.com/watch?v=xTpHD5WLuoA;License: Standard YouTube License, CC-BY