Concept explainers
Videos
(a)
Plot the data and the regression line on the same axes. Does the line fit the data well?
(a)
Answer to Problem 1P
Yes, the line fits the data well
Explanation of Solution
Given information:
Table gives the gross world product, G, which measures output of goods and services. If t is in years since 1950, the regression line these data is
G in tillions of 1999 dollars.
| Year | 1950 | 1960 | 1970 | 1980 | 1990 | 2000 |
| G | 6.4 | 10.0 | 16.3 | 23.6 | 31.9 | 43.2 |
Calculation:
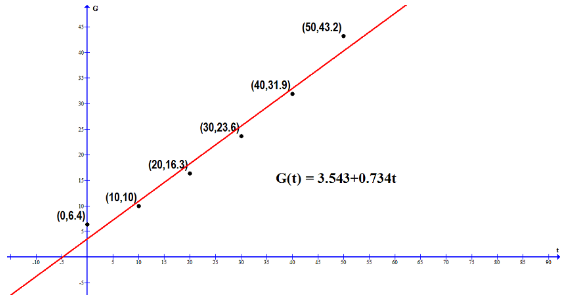
Yes, the line fits the data well (is in fact the linear regression line) with
(b)
Interpret the slope of the line in terms of gross world product.
(b)
Explanation of Solution
The gross world product, G, which measures global output of goods and services is given by
Hence, the slope of G ( t ) indicates that gross world product increases by 0.734 trillion dollars every year.
(c)
Use the regression line to estimate gross world product in 2005 and in 2020. Comment on your confidence in the two predictions.
(c)
Answer to Problem 1P
The gross world product in 2005 = 1475.213 trillion dollars
The gross world product in 2020 = 1486.223 trillion dollars
Both predictions cannot be made confidently.
Explanation of Solution
Given information:
Table A.5 gives the gross world product, G, which measures output of goods and services. If t is in years since 1950, the regression line these data is
| Year | 1950 | 1960 | 1970 | 1980 | 1990 | 2000 |
| G | 6.4 | 10.0 | 16.3 | 23.6 | 31.9 | 43.2 |
Calculation:
The gross world product, G, which measures global output of goods and services is given by
Both predictions cannot be made confidently because:
- Uniform increase in gross world product every year is highly unlikely in actual scenario.
- A recession (for example the one in 2009) can also lead to decrease in gross world product.
Thus, the gross world product in 2005 = 1475.213 trillion dollars
The gross world product in 2020 = 1486.223 trillion dollars
Both predictions cannot be made confidently.
Want to see more full solutions like this?
Chapter A Solutions
EBK APPLIED CALCULUS, ENHANCED ETEXT


- 4. Suppose that A is made up of 5 column vectors in R³, and suppose that the rank(A)=3. a. How many solutions are there to Ax=0? Justify. b. What is a geometric description for the nullspace(A)? Justify. c. Do the column vectors of A span R³? Justify. d. Is A invertible? Justify.arrow_forward3. Suppose that A is 5 x 5 and rank(A)=4. Use this information to answer the following. a. Give a geometric description of nullspace(A). Justify. b. Is A invertible? Justify. c. Give a geometric description of the span of the column vectors of A. What space are the column vectors of A in? Justify. d. What is determinant of A? Justify.arrow_forward2. Consider the matrix: A || 1 1 -3 14 2 1 01 4 1 2 2 -26 1 -3 1 5] a) What is rank(A)? b) Is A invertible? Justify. c) Find the nullspace(A). Justify. d) Is the trivial solution the only solution to Ax=0? Justify. e) What is the span of the column vectors of A? Justify.arrow_forward
- E 5. Suppose that S={v € R²: v = [2x² - 3]}. Is S a subspace of R²? Prove or disprovearrow_forward6. Suppose that V1, V2 ER", show that span{v1, v2} is a subspace of Rn.arrow_forwardRa X 2) slots per pole per phase 3/31 180 Ko Sin (1) Kdl 1 sin (4) sin(3) Sin (30) اذا مرید شرح الكتب بس 0 بالفراغ 3) Cos (30) 0.866 4) Rotating 5) Synchronous speed, 120 Fo lasa! G s.1000-950 20:05 1000 Capper losses: 5kw Rotor input lookw 0.05 ined sove in peaper I need a detailed solution on paper please 6) 1 ۳/۱ وه اذا ميريد شرح الكتب فقط look DC 7) rotov Find the general solution of the following equations: +4y=tan2x 3 7357 Find the general solution of the following equations: - Qll y + y (³) = 0. 101arrow_forward
- B: 18060 msl Kd Ka, Sin (n) I sin () sin(30) Sin (30) اذا ميريد شرح الكتب بس 0 بالفراغ 3) Cos (30) 0.866 4) Rotating 5) Synchronous speed, 120 x 50 G 5005 1000 s = 1000-950 Copper bosses 5kW /0001 Rotor input 5 : loo kw 0.05 6) 1 اذا ميريد شرح الكتب فقط ١٥٠ 7) rotov DC ined sove in Deaper I need a detailed solution on paper please dy x+2y-4 = dx 2x-y-3 Find the general solution of the following equations: 02//yl-4y+13y=esinarrow_forward1) R₂ = X2 2) slots per pole per phase = 3/31 B msl kd 180 60 Kal Sin (1) I sin () sin(30) Sin (30) اذا ميريد شرح الكتب بس 0 بالفراغ 3) Cos (30) 0.866 4) Rotating 5) Synchronous speed, 120 x 50 G 5005 1000 s = 1000-950 Copper bosses 5kW Rotor input: 5 0.05 loo kw 6) 1 /0001 اذا ميريد شرح الكتب فقط look 7) rotov DC ined sove in peaper I need a detailed solution on paper please Q1// Find the solution of: 'y' = x² +376 x4+316 xyo Q2 Find the solution of the initial-valued problems: ex-y y' +exarrow_forwardR₂ = X2 2) slots per pole per phase = 3/31 B-18060 msl kd Kasi Sin (1) I sin (6) sin(30) Sin (30) اذا ميريد شرح الكتب بس 0 بالفراغ 3) Cos (30) 0.866 4) Rotating 5) Synchronous speed s = 1000-950 1000 Copper losses: 5kw Rotor input 5 0.05 6) 1 120 x 50 G loo kw ined sove in peaper I need a detailed solution on paper please Q3// x²y// +xy/ + (x² - ½) y = x³/². اذا ميريد شرح الكتب فقط look 7) rotor DC Q4// x²y// - (2x+x²)y/ + (2 + x)y = x³. dy 2x+2y+4 = dx 2x-y-3arrow_forward
- ۳/۱ R2X2 2) slots per pole per phase = 3/31 B, 18060 msl Kas Sin() 1sin() sin(30) Sin (30) kd اذا ميريد شرح الكتب بس 0 بالفراغ 3) Cos (30) 0.866 4) Rotating 5) Synchronous speeds S = 1000-950 1000 Copper bosses 5kw 120*50 loca G Rotor input 5 loo kw 6) 1 0.05 اذا ميريد شرح الكتب فقط lookw 7) rotor DC ined sove in peaper I need a detailed solution on paper please 064 Q1// Find the solution of QI/Find the solution of Inxy= 7357 x+2y³ y' = xy3arrow_forwardR₂ = X2 2) slots per pole per phase 3/31 msl 180 60 Kd Ka Sin (1) Isin (6) sin(30) Sin (30) اذا ميريد شرح الكتب بس 0 بالفراغ 3) Cos (30) 0.866 4) Rotating 5) Synchronous speed, 120*50 1000 6 S = 1000-950 1000 Copper bosses: 5kw Rotor input 5 0.05 : loo kw 6) 1 اذا ميريد شرح الكتب فقط 100 7) rotor DC ined sove in peaper I need a detailed solution on paper please Find the general solution of the following equations: Q2lyl-4y+13y=esinx. Find the general solution of the following equations: " Qly (49) - 16y= 0. 151arrow_forward۳/۱ R₂ = X2 2) slots per pole per phase = 3/31 B-18060 msl kd Kasi Sin (1) I sin (6) sin(30) Sin (30) اذا ميريد شرح الكتب بس 0 بالفراغ 3) Cos (30) 0.866 4) Rotating 5) Synchronous speed s = 1000-950 1000 Copper losses: 5kw Rotor input 5 0.05 6) 1 120 x 50 G loo kw اذا میرید شرح الكتب فقط look 7) rotor DC ined sove in peaper I need a detailed solution on paper dy please 04 12=-cosx.y + 2cosx with y(x) = 1 か 'Oy + xlny + xe")dx + (xsiny + xlnx +*dy=0. 01arrow_forward
 Glencoe Algebra 1, Student Edition, 9780079039897...AlgebraISBN:9780079039897Author:CarterPublisher:McGraw Hill
 Functions and Change: A Modeling Approach to Coll...AlgebraISBN:9781337111348Author:Bruce Crauder, Benny Evans, Alan NoellPublisher:Cengage Learning
 Algebra & Trigonometry with Analytic GeometryAlgebraISBN:9781133382119Author:SwokowskiPublisher:Cengage

 Algebra and Trigonometry (MindTap Course List)AlgebraISBN:9781305071742Author:James Stewart, Lothar Redlin, Saleem WatsonPublisher:Cengage Learning