
Concept explainers
Videos
To graph: the
Explanation of Solution
Given information:
The complex number is
Graph: to draw the graph of complex number, start from the origin and move two unit to the right and then move
Thus, the graph can be obtained as:
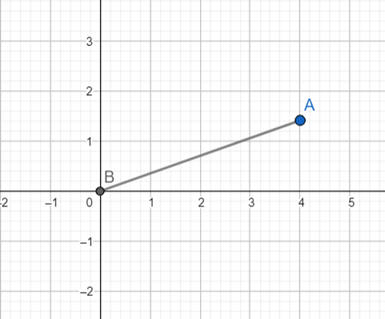
Interpretation: from the above graph it can be observed that the absolute value of complex number is
Chapter 9 Solutions
Advanced Mathematical Concepts: Precalculus with Applications, Student Edition
Additional Math Textbook Solutions
Elementary Statistics (13th Edition)
Calculus: Early Transcendentals (2nd Edition)
Using and Understanding Mathematics: A Quantitative Reasoning Approach (6th Edition)
A Problem Solving Approach To Mathematics For Elementary School Teachers (13th Edition)
A First Course in Probability (10th Edition)
Basic Business Statistics, Student Value Edition


- Problem 11 (a) A tank is discharging water through an orifice at a depth of T meter below the surface of the water whose area is A m². The following are the values of a for the corresponding values of A: A 1.257 1.390 x 1.50 1.65 1.520 1.650 1.809 1.962 2.123 2.295 2.462|2.650 1.80 1.95 2.10 2.25 2.40 2.55 2.70 2.85 Using the formula -3.0 (0.018)T = dx. calculate T, the time in seconds for the level of the water to drop from 3.0 m to 1.5 m above the orifice. (b) The velocity of a train which starts from rest is given by the fol- lowing table, the time being reckoned in minutes from the start and the speed in km/hour: | † (minutes) |2|4 6 8 10 12 14 16 18 20 v (km/hr) 16 28.8 40 46.4 51.2 32.0 17.6 8 3.2 0 Estimate approximately the total distance ran in 20 minutes.arrow_forwardX Solve numerically: = 0,95 In xarrow_forwardX Solve numerically: = 0,95 In xarrow_forward
- Please as many detarrow_forward8–23. Sketching vector fields Sketch the following vector fieldsarrow_forward25-30. Normal and tangential components For the vector field F and curve C, complete the following: a. Determine the points (if any) along the curve C at which the vector field F is tangent to C. b. Determine the points (if any) along the curve C at which the vector field F is normal to C. c. Sketch C and a few representative vectors of F on C. 25. F = (2½³, 0); c = {(x, y); y − x² = 1} 26. F = x (23 - 212) ; C = {(x, y); y = x² = 1}) , 2 27. F(x, y); C = {(x, y): x² + y² = 4} 28. F = (y, x); C = {(x, y): x² + y² = 1} 29. F = (x, y); C = 30. F = (y, x); C = {(x, y): x = 1} {(x, y): x² + y² = 1}arrow_forward
- ٣/١ B msl kd 180 Ka, Sin (1) I sin () sin(30) Sin (30) اذا ميريد شرح الكتب بس 0 بالفراغ 3) Cos (30) 0.866 4) Rotating 5) Synchronous speed, 120 x 50 G 5005 1000 s = 1000-950 Copper bosses 5kW Rotor input 5 0.05 : loo kw 6) 1 /0001 ined sove in peaper I need a detailed solution on paper please وه اذا ميريد شرح الكتب فقط ١٥٠ DC 7) rotor a ' (y+xlny + xe*)dx + (xsiny + xlnx + dy = 0. Q1// Find the solution of: ( 357arrow_forward۳/۱ R₂ = X2 2) slots per pole per phase 3/31 B. 180 msl Kas Sin (I) 1sin() sin(30) Sin (30) اذا ميريد شرح الكتب بس 0 بالفراغ 3) Cos (30): 0.866 4) Rotating 5) Synchronous speeds 120×50 looo G 1000-950 1000 Copper losses 5kw Rotor input 5 loo kw 0.05 6) 1 اذا ميريد شرح الكتب فقط look 7) rotor DC ined sove in peaper I need a detailed solution on paper please 0 64 Find the general solution of the following equations: QI//y(4)-16y= 0. Find the general solution of the following equations: Q2ll yll-4y/ +13y=esinx.arrow_forwardR₂ = X2 2) slots per pole per phase = 3/31 B-180 60 msl kd Kas Sin () 2 I sin (6) sin(30) Sin (30) اذا مريد شرح الكتب بس 0 بالفراغ 3 Cos (30) 0.866 4) Rotating ined sove in peaper 5) Synchronous speed s 120×50 6 s = 1000-950 1000 Copper losses 5kw Rotor input 5 0.05 6) 1 loo kw اذا ميريد شرح الكتب فقط Look 7) rotov DC I need a detailed solution on paper please 0 64 Solve the following equations: 0 Q1// Find the solution of: ( y • with y(0) = 1. dx x²+y²arrow_forward
- R₂ = X2 2) slots per pole per phase = 3/3 1 B-180-60 msl Ka Sin (1) Isin () sin(30) Sin (30) اذا ميريد شرح الكتب بس 0 بالفراغ 3) Cos (30) 0.866 4) Rotating 5) Synchronous speed, 120 x 50 s = 1000-950 1000 Copper losses 5kw Rotor input 5 6) 1 0.05 G 50105 loo kw اذا ميريد شرح الكتب فقط look 7) rotov DC ined sove in peaper I need a detailed solution on paper please 064 2- A hot ball (D=15 cm ) is cooled by forced air T.-30°C, the rate of heat transfer from the ball is 460.86 W. Take for the air -0.025 Wim °C and Nu=144.89, find the ball surface temperature a) 300 °C 16 b) 327 °C c) 376 °C d) None か = 750 01arrow_forwardDon't do 14. Please solve 19arrow_forwardPlease solve 14 and 15arrow_forward
 Calculus: Early TranscendentalsCalculusISBN:9781285741550Author:James StewartPublisher:Cengage Learning
 Thomas' Calculus (14th Edition)CalculusISBN:9780134438986Author:Joel R. Hass, Christopher E. Heil, Maurice D. WeirPublisher:PEARSON
 Calculus: Early Transcendentals (3rd Edition)CalculusISBN:9780134763644Author:William L. Briggs, Lyle Cochran, Bernard Gillett, Eric SchulzPublisher:PEARSON
 Calculus: Early TranscendentalsCalculusISBN:9781319050740Author:Jon Rogawski, Colin Adams, Robert FranzosaPublisher:W. H. Freeman
 Calculus: Early Transcendental FunctionsCalculusISBN:9781337552516Author:Ron Larson, Bruce H. EdwardsPublisher:Cengage Learning