
Videos
Automatic Transmissions
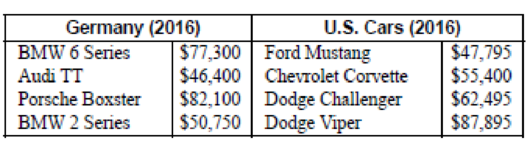
Assume the following data values are from a 2016 Auto Guide. The guide compared various parameters of U.S.- and foreign-made cars. This report centers on the price of an optional automatic transmission. Which country has the greater variability in the price of automatic transmissions? Answer the following questions.
1. What is the null hypothesis?
2. What test statistic is used to test for any significant differences in the variances?
3. Is there a significant difference in the variability in the prices between the German cars and the U.S. cars?
4. What effect does a small
5. What degrees of freedom are used for the statistical test?
6. Could two sets of data have significantly different variances without having significantly different means?
1.
To write: The null hypothesis.
Answer to Problem 1AC
The null hypothesis is,
Explanation of Solution
Given info:
The data shows that the data values from a 2016 Auto Guide. The guide compared various parameters of U.S.- and foreign-made cars and greater variability in the price of automatic transmissions for the countries is tested.
Justification:
Here, it is observed that the greater variability in the price of automatic transmissions for the countries is tested.
Thus, the null hypothesis can be written as,
2.
To identify: The test is used to test for any significant difference in the variances.
Answer to Problem 1AC
The test is used to test for any significant difference in the variances is F-test.
Explanation of Solution
Justification:
F-test:
The F-test is used to test for the significant difference in the variances.
Here, it is observed that F-test is used to test for any significant difference in the variances.
3.
To test: Whether there is a significant difference in the variability in the prices between the German cars and the U.S. cars.
Answer to Problem 1AC
There is no sufficient evidence to support the claim that there is a significant difference in the variability in the prices between the German cars and the U.S. cars.
Explanation of Solution
Justification:
Step by step procedure for finding the sample variances using Minitab procedure is,
- Choose Stat > Basic Statistics > Display Descriptive Statistics.
- In Variables enter the columns Germany (2016) and U.S. Cars (2016).
- Choose option statistics, and select Variance.
- Click OK.
Output using Minitab procedure is,
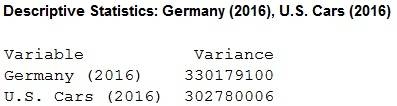
Here, the sample variances
Where,
Here, the variability in the price of automatic transmissions for the countries is tested. Hence, the claim is that,
Test statistic:
The formula to find the F-statistic is,
Substitute
Thus, the F-statistic value is 1.090.
Degrees of freedom:
The degrees of freedom are
That is,
Critical value:
The level of significance is
Divide the level of significance by 2.
That is,
The critical F-value for a two-tailed test is obtained using the Table H: The F-Distribution with the level of significance 0.025.
Procedure:
- Locate 3 in the degrees of freedom, denominator row of the Table H.
- Obtain the value in the corresponding degrees of freedom, numerator column below 3.
That is,
Rejection region:
The null hypothesis would be rejected if
Conclusion:
Here, the F-value is lesser than the critical value.
That is,
Thus, it can be concluding that the null hypothesis is not rejected.
Hence, there is no sufficient evidence to support the claim that there is a significant difference in the variability in the prices between the German cars and the U.S. cars.
4.
The effect of the small sample sizes have on the standard deviations.
Answer to Problem 1AC
The effect of the small sample sizes have on the standard deviations is the small sample sizes are impacted by outliers.
Explanation of Solution
Justification:
Here, it is observed that taking the small sample sizes gives the do not give appropriate results because the small sample sizes are impacted by outliers. Thus, it can be conclude that effect of the small sample sizes have on the standard deviations is the small sample sizes are impacted by outliers.
5.
To find: The degrees of freedom are used for the statistical test.
Answer to Problem 1AC
The degrees of freedom are used for the numerator and denominator both 3.
Explanation of Solution
Justification:
Form the part (3), it can be observed that thedegrees of freedom are used for the numerator and denominator 3.
6.
To check: Whether the two sets of data have significantly different variances without having significantly different means.
Answer to Problem 1AC
Yes, the two sets of data have significantly different variances without having significantly different means.
Explanation of Solution
Justification:
From the given information, it can be observed that the mean of the two sets of data is same in the center but the standard deviations of the two sets are different. Thus, it can be conclude that the two sets of data have significantly different variances without having significantly different means.
Want to see more full solutions like this?
Chapter 9 Solutions
ALEKS 360 BLUMAN ELE.STAT:A STEP.(11WKS)


- A smallish urn contains 25 small plastic bunnies – 7 of which are pink and 18 of which are white. 10 bunnies are drawn from the urn at random with replacement, and X is the number of pink bunnies that are drawn. (a) P(X = 5) ≈ (b) P(X<6) ≈ The Whoville small urn contains 100 marbles – 60 blue and 40 orange. The Grinch sneaks in one night and grabs a simple random sample (without replacement) of 15 marbles. (a) The probability that the Grinch gets exactly 6 blue marbles is [ Select ] ["≈ 0.054", "≈ 0.043", "≈ 0.061"] . (b) The probability that the Grinch gets at least 7 blue marbles is [ Select ] ["≈ 0.922", "≈ 0.905", "≈ 0.893"] . (c) The probability that the Grinch gets between 8 and 12 blue marbles (inclusive) is [ Select ] ["≈ 0.801", "≈ 0.760", "≈ 0.786"] . The Whoville small urn contains 100 marbles – 60 blue and 40 orange. The Grinch sneaks in one night and grabs a simple random sample (without replacement) of 15 marbles. (a)…arrow_forwardSuppose an experiment was conducted to compare the mileage(km) per litre obtained by competing brands of petrol I,II,III. Three new Mazda, three new Toyota and three new Nissan cars were available for experimentation. During the experiment the cars would operate under same conditions in order to eliminate the effect of external variables on the distance travelled per litre on the assigned brand of petrol. The data is given as below: Brands of Petrol Mazda Toyota Nissan I 10.6 12.0 11.0 II 9.0 15.0 12.0 III 12.0 17.4 13.0 (a) Test at the 5% level of significance whether there are signi cant differences among the brands of fuels and also among the cars. [10] (b) Compute the standard error for comparing any two fuel brands means. Hence compare, at the 5% level of significance, each of fuel brands II, and III with the standard fuel brand I. [10] �arrow_forwardBusiness discussarrow_forward
- What would you say about a set of quantitative bivariate data whose linear correlation is -1? What would a scatter diagram of the data look like? (5 points)arrow_forwardBusiness discussarrow_forwardAnalyze the residuals of a linear regression model and select the best response. yes, the residual plot does not show a curve no, the residual plot shows a curve yes, the residual plot shows a curve no, the residual plot does not show a curve I answered, "No, the residual plot shows a curve." (and this was incorrect). I am not sure why I keep getting these wrong when the answer seems obvious. Please help me understand what the yes and no references in the answer.arrow_forward
- a. Find the value of A.b. Find pX(x) and py(y).c. Find pX|y(x|y) and py|X(y|x)d. Are x and y independent? Why or why not?arrow_forwardAnalyze the residuals of a linear regression model and select the best response.Criteria is simple evaluation of possible indications of an exponential model vs. linear model) no, the residual plot does not show a curve yes, the residual plot does not show a curve yes, the residual plot shows a curve no, the residual plot shows a curve I selected: yes, the residual plot shows a curve and it is INCORRECT. Can u help me understand why?arrow_forwardYou have been hired as an intern to run analyses on the data and report the results back to Sarah; the five questions that Sarah needs you to address are given below. please do it step by step on excel Does there appear to be a positive or negative relationship between price and screen size? Use a scatter plot to examine the relationship. Determine and interpret the correlation coefficient between the two variables. In your interpretation, discuss the direction of the relationship (positive, negative, or zero relationship). Also discuss the strength of the relationship. Estimate the relationship between screen size and price using a simple linear regression model and interpret the estimated coefficients. (In your interpretation, tell the dollar amount by which price will change for each unit of increase in screen size). Include the manufacturer dummy variable (Samsung=1, 0 otherwise) and estimate the relationship between screen size, price and manufacturer dummy as a multiple…arrow_forward
- Here is data with as the response variable. x y54.4 19.124.9 99.334.5 9.476.6 0.359.4 4.554.4 0.139.2 56.354 15.773.8 9-156.1 319.2Make a scatter plot of this data. Which point is an outlier? Enter as an ordered pair, e.g., (x,y). (x,y)= Find the regression equation for the data set without the outlier. Enter the equation of the form mx+b rounded to three decimal places. y_wo= Find the regression equation for the data set with the outlier. Enter the equation of the form mx+b rounded to three decimal places. y_w=arrow_forwardYou have been hired as an intern to run analyses on the data and report the results back to Sarah; the five questions that Sarah needs you to address are given below. please do it step by step Does there appear to be a positive or negative relationship between price and screen size? Use a scatter plot to examine the relationship. Determine and interpret the correlation coefficient between the two variables. In your interpretation, discuss the direction of the relationship (positive, negative, or zero relationship). Also discuss the strength of the relationship. Estimate the relationship between screen size and price using a simple linear regression model and interpret the estimated coefficients. (In your interpretation, tell the dollar amount by which price will change for each unit of increase in screen size). Include the manufacturer dummy variable (Samsung=1, 0 otherwise) and estimate the relationship between screen size, price and manufacturer dummy as a multiple linear…arrow_forwardExercises: Find all the whole number solutions of the congruence equation. 1. 3x 8 mod 11 2. 2x+3= 8 mod 12 3. 3x+12= 7 mod 10 4. 4x+6= 5 mod 8 5. 5x+3= 8 mod 12arrow_forward
 Glencoe Algebra 1, Student Edition, 9780079039897...AlgebraISBN:9780079039897Author:CarterPublisher:McGraw Hill
 Big Ideas Math A Bridge To Success Algebra 1: Stu...AlgebraISBN:9781680331141Author:HOUGHTON MIFFLIN HARCOURTPublisher:Houghton Mifflin Harcourt
 Holt Mcdougal Larson Pre-algebra: Student Edition...AlgebraISBN:9780547587776Author:HOLT MCDOUGALPublisher:HOLT MCDOUGAL