Concept explainers
Videos
a.
To find: A geometric sequence that models the data from 2004 through 2010.
a.
Answer to Problem 86E
Explanation of Solution
Given: The table shows the mid-year populations

Since
First we draw the graph using exponential regression.
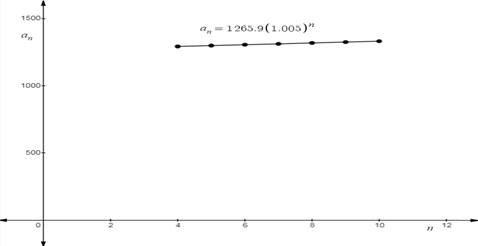
Using exponential regression graphing utility the geometric sequence is
b.
To find: The rate of population of china is growing.
b.
Answer to Problem 86E
0.5%
Explanation of Solution
Given: The geometric sequence of the data is
The model of data,
Rate
Hence, the rate is 0.5% per year.
c.
To find: The population of china in 2017.
c.
Answer to Problem 86E
5.81 million
Explanation of Solution
Given: The geometric sequence of the data is
Since
Therefore, 2017 will
Put
Using geometric sequence model the population of China in 2017 will be 1377.91 million.
But the U.S. Census Bureau predicts the population of China will be 1372.1 million in 2017.
U.S. Census Bureau predicts lesser population as compare to model.
Difference
Hence, U.S. Census Bureau prediction is 5.81 million population lesser.
d.
To find: The year when population of china will be 1.4 billion.
d.
Answer to Problem 86E
2020 year
Explanation of Solution
Given: The geometric sequence of the data is
Since
The population of China will be 1.4 billion.
1 billion = 1000 million
Therefore, 1.4 billion = 1400 million
Put
Hence, the population of China will be 1.4 billion in 2020.
Chapter 9 Solutions
Precalculus with Limits


- Q6. A fossil piece has been found in Alberta that contains 34% of C14 in it. What is the age of this fossil piece?arrow_forwardQ5. Briefly explain what are isotopes of an elements, with an example, and why some isotopes are radioactive. 470arrow_forwardQ1. Will you earn more interest amount in two years by depositing $2000 in a simple interest account that pays 6% or in an account that pays 6.15% interest compounded monthly? tarrow_forward
- Q4. We want to invest $18000 in an account compounded continuously. How long should the investment be kept so final value of the account reaches $25000 if the annual rate of interest is 5.8%?arrow_forwardQ3. Determine the effective annual yield for each investment below. Then select the better investment. Assume 365 days in a year. a) 5.6% compounded semiannually; b) 5.4% compounded daily.arrow_forwardQ2. You deposit $22,000 in an account that pays 4.8% interest compounded monthly. a. Find the future value after six years. & b b. Determine the effective annual yield of this account.arrow_forward
- 18. Using the method of variation of parameter, a particular solution to y′′ + 16y = 4 sec(4t) isyp(t) = u1(t) cos(4t) + u2(t) sin(4t). Then u2(t) is equal toA. 1 B. t C. ln | sin 4t| D. ln | cos 4t| E. sec(4t)arrow_forwardQuestion 4. Suppose you need to know an equation of the tangent plane to a surface S at the point P(2, 1, 3). You don't have an equation for S but you know that the curves r1(t) = (2 + 3t, 1 — t², 3 − 4t + t²) r2(u) = (1 + u², 2u³ − 1, 2u + 1) both lie on S. (a) Check that both r₁ and r2 pass through the point P. 1 (b) Give the expression of the 074 in two ways Ət ⚫ in terms of 32 and 33 using the chain rule მყ ⚫ in terms of t using the expression of z(t) in the curve r1 (c) Similarly, give the expression of the 22 in two ways Əz ди ⚫ in terms of oz and oz using the chain rule Əz მყ • in terms of u using the expression of z(u) in the curve r2 (d) Deduce the partial derivative 32 and 33 at the point P and the equation of მე მყ the tangent planearrow_forwardCoast Guard Patrol Search Mission The pilot of a Coast Guard patrol aircraft on a search mission had just spotted a disabled fishing trawler and decided to go in for a closer look. Flying in a straight line at a constant altitude of 1000 ft and at a steady speed of 256 ft/s, the aircraft passed directly over the trawler. How fast (in ft/s) was the aircraft receding from the trawler when it was 1400 ft from the trawler? (Round your answer to one decimal places.) 1000 ft 180 × ft/s Need Help? Read It SUBMIT ANSWERarrow_forward
- 6. The largest interval in which the solution of (cos t)y′′ +t^2y′ − (5/t)y = e^t/(t−3) , y(1) = 2, y′(1) = 0is guaranteed to exist by the Existence and Uniqueness Theorem is:A. (0, ∞) B. (π/2, 3) C. (0,π/2) D. (0, π) E. (0, 3)arrow_forward12. For the differential equation in the previous question, what is the correct form for a particularsolution?A. yp = Ae^t + Bt^2 B. yp = Ae^t + Bt^2 + Ct + DC. yp = Ate^t + Bt^2 D. yp = Ate^t + Bt^2 + Ct + D Previous differential equation y′′ − 4y′ + 3y = e^t + t^2arrow_forward16. The appropriate form for the particular solution yp(x) of y^(3) − y′′ − 2y′ = x^2 + e^2x isA. yp(x) = Ax^2 + Bx + C + De^2x B. yp(x) = Ax^3 + Bx^2 + Cx + Dxe^2xC. yp(x) = Ax^2 +Be^2x D. yp(x) = A+Be^2x +Ce^−x E. yp(x) = Ax^2 +Bx+C +(Dx+E)e^2xarrow_forward
 Calculus: Early TranscendentalsCalculusISBN:9781285741550Author:James StewartPublisher:Cengage Learning
 Thomas' Calculus (14th Edition)CalculusISBN:9780134438986Author:Joel R. Hass, Christopher E. Heil, Maurice D. WeirPublisher:PEARSON
 Calculus: Early Transcendentals (3rd Edition)CalculusISBN:9780134763644Author:William L. Briggs, Lyle Cochran, Bernard Gillett, Eric SchulzPublisher:PEARSON
 Calculus: Early TranscendentalsCalculusISBN:9781319050740Author:Jon Rogawski, Colin Adams, Robert FranzosaPublisher:W. H. Freeman
 Calculus: Early Transcendental FunctionsCalculusISBN:9781337552516Author:Ron Larson, Bruce H. EdwardsPublisher:Cengage Learning