Prealgebra (6th Edition)
6th Edition
ISBN: 9780134179018
Author: Jamie Blair, John Tobey Jr., Jeffrey Slater, Jenny Crawford
Publisher: PEARSON
expand_more
expand_more
format_list_bulleted
Question
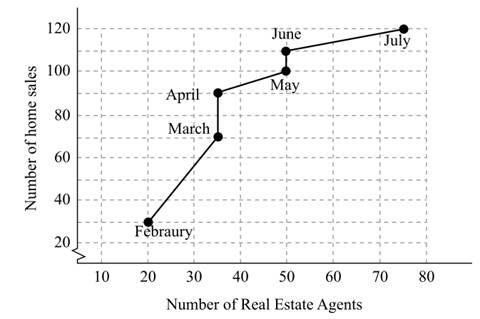
Chapter 9.3, Problem 6E
To determine
The number of real estate agents and the respective number of home sales for the months of May, June and July from the graph of real estate Company between the number of real estate agents and the number of home sales for the company that is provided as:
Expert Solution & Answer
Want to see the full answer?
Check out a sample textbook solution
Students have asked these similar questions
I need help explaining on this example on how can I define the Time-Domain Function, Apply the Laplace Transformation Formula, and Simplify to Find the Frequency-Domain Expression. I need to understand on finding Y(s)
1. A bicyclist is riding their bike along the Chicago Lakefront Trail. The velocity (in
feet per second) of the bicyclist is recorded below. Use (a) Simpson's Rule, and (b)
the Trapezoidal Rule to estimate the total distance the bicyclist traveled during the
8-second period.
t
0 2
4 6 8
V
10 15
12 10 16
2. Find the midpoint rule approximation for
(a) n = 4
+5
x²dx using n subintervals.
1° 2
(b) n = 8
36
32
28
36
32
28
24
24
20
20
16
16
12
8-
4
1
2
3
4
5
6
12
8
4
1
2
3
4
5
6
1. A Blue Whale's resting heart rate has period that happens to be approximately equal to 2π. A typical ECG of a whale's heartbeat
over one period may be approximated by the function,
f(x)
=
0.005x4
2
0.005x³-0.364x² + 1.27x
on the interval [0, 27]. Find an nth-order Fourier approximation to the Blue Whale's heartbeat, where n ≥ 3 is different from
that used in any other posts on this topic, to generate a periodic function that can be used to model its heartbeat, and graph your
result. Be sure to include your chosen value of n in your Subject Heading.
Chapter 9 Solutions
Prealgebra (6th Edition)
Ch. 9.1 - Coffee Consumption Use the pictograph to answer...Ch. 9.1 - Coffee Consumption Use the pictograph to answer...Ch. 9.1 - Coffee Consumption Use the pictograph to answer...Ch. 9.1 - Coffee Consumption Use the pictograph to answer...Ch. 9.1 - Prob. 5ECh. 9.1 - Prob. 6ECh. 9.1 - Population Density Use this pictograph to answer...Ch. 9.1 - Prob. 8ECh. 9.1 - Population Density Use this pictograph to answer...Ch. 9.1 - Prob. 10E
Ch. 9.1 - Prob. 11ECh. 9.1 - Household Expenses The average household expenses...Ch. 9.1 - Prob. 13ECh. 9.1 - Prob. 14ECh. 9.1 - Prob. 15ECh. 9.1 - Prob. 16ECh. 9.1 - Prob. 17ECh. 9.1 - Prob. 18ECh. 9.1 - Prob. 19ECh. 9.1 - Prob. 20ECh. 9.1 - Prob. 21ECh. 9.1 - Emergency Room Visits In the United States...Ch. 9.1 - Prob. 23ECh. 9.1 - Prob. 24ECh. 9.1 - Prob. 25ECh. 9.1 - Prob. 26ECh. 9.1 - Prob. 27ECh. 9.1 - Prob. 28ECh. 9.1 - Prob. 29ECh. 9.1 - Prob. 30ECh. 9.1 - Prob. 31ECh. 9.1 - Prob. 32ECh. 9.1 - Prob. 33ECh. 9.1 - Prob. 34ECh. 9.1 - Prob. 35ECh. 9.1 - Prob. 36ECh. 9.1 - Prob. 37ECh. 9.1 - Prob. 38ECh. 9.1 - Prob. 39ECh. 9.1 - Monthly Precipitation The comparison line graph...Ch. 9.1 - Prob. 41ECh. 9.1 - Prob. 42ECh. 9.1 - Prob. 43ECh. 9.1 - Prob. 44ECh. 9.1 - Prob. 45ECh. 9.1 - Fat and Carbohydrates Use the table to make a...Ch. 9.1 - Life Insurance Use the information in the table to...Ch. 9.1 - Life Insurance Use the information in the table to...Ch. 9.1 - Mobile Device Accessories Use the information in...Ch. 9.1 - Mobile Device Accessories Use the information in...Ch. 9.1 - Sport Event Tickets Use the circle graph for...Ch. 9.1 - Perform the operation indicated. [6.1.4]...Ch. 9.1 - Prob. 53ECh. 9.1 - Perform the operation indicated. [6.4.2] Factor....Ch. 9.1 - Use the information in the table for exercises...Ch. 9.1 - Refer to the circle graph in exercise 51 to answer...Ch. 9.1 - Use the information in the table to construct a...Ch. 9.1 - Concept Check The college administration is...Ch. 9.2 - Prob. 1ECh. 9.2 - Prob. 2ECh. 9.2 - Prob. 3ECh. 9.2 - Prob. 4ECh. 9.2 - Prob. 5ECh. 9.2 - Prob. 6ECh. 9.2 - Prob. 7ECh. 9.2 - Prob. 8ECh. 9.2 - Prob. 9ECh. 9.2 - Prob. 10ECh. 9.2 - Prob. 11ECh. 9.2 - Sales Record The double-bar graph shows the number...Ch. 9.2 - Baseball The captain of the college baseball team...Ch. 9.2 - Bowling The captain of the college bowling team...Ch. 9.2 - Prob. 15ECh. 9.2 - Gasoline Mileage Cindy and Andrea traveled to...Ch. 9.2 - Prob. 17ECh. 9.2 - Prob. 18ECh. 9.2 - Prob. 19ECh. 9.2 - Prob. 20ECh. 9.2 - Prob. 21ECh. 9.2 - Prob. 22ECh. 9.2 - Prob. 23ECh. 9.2 - Prob. 24ECh. 9.2 - Prob. 25ECh. 9.2 - Prob. 26ECh. 9.2 - Cell Phone Usage The numbers of cell phone minutes...Ch. 9.2 - Swimmers' Ages The ages of 10 people swimming laps...Ch. 9.2 - Prob. 29ECh. 9.2 - Prob. 30ECh. 9.2 - Find the median value. Actors in a Play The...Ch. 9.2 - Find the median value. Football Injuries The...Ch. 9.2 - Prob. 33ECh. 9.2 - Find the mode. 86, 84, 86, 87, 84, 83, 90Ch. 9.2 - Prob. 35ECh. 9.2 - Find the mode. 144, 143, 140, 141, 149, 144, 141,...Ch. 9.2 - Prob. 37ECh. 9.2 - TVs Sold The last six flat-screen television sets...Ch. 9.2 - Find the mean, median, and mode for each set of...Ch. 9.2 - Prob. 40ECh. 9.2 - Find the mean, median, and mode for each set of...Ch. 9.2 - Find the mean, median, and mode for each set of...Ch. 9.2 - Study Time Dawn studies and completes homework for...Ch. 9.2 - Restaurant Ratings Sara's Seafood Place received...Ch. 9.2 - Use the table for exercises 45 and 46. Round to...Ch. 9.2 - Use the table for exercises 45 and 46. Round to...Ch. 9.2 - Monthly Salaries A local travel office has 10...Ch. 9.2 - Track Meet A college track star ran the 100-meter...Ch. 9.2 - Prob. 49ECh. 9.2 - Find the median value. 15.276; 21.375; 18.90;...Ch. 9.2 - Evaluate. [2.6.2] x2+4forx=26Ch. 9.2 - Evaluate. [2.6.2] 35x-9forx=7Ch. 9.2 - Evaluate. [2.6.2] 2x+1forx=5Ch. 9.2 - Evaluate. [2.6.2] 3x7forx=0Ch. 9.2 - [5.1.3]Roofing Cost Wesley is putting a new roof...Ch. 9.2 - [2.3.3]Mountain Altitude The highest mountain in...Ch. 9.2 - Find the average or mean quiz score for Jake if he...Ch. 9.2 - Find the median of each of the following. a. 17,...Ch. 9.2 - Find the mode of each of the following. a. Sara...Ch. 9.3 - Describe in words the directions you move on the...Ch. 9.3 - Describe in words the directions you move on the...Ch. 9.3 - Online Orders Use the line graph to answer...Ch. 9.3 - Prob. 4ECh. 9.3 - Prob. 5ECh. 9.3 - Prob. 6ECh. 9.3 - Plot and label the ordered pairs on the...Ch. 9.3 - Plot and label the ordered pairs on the...Ch. 9.3 - Prob. 9ECh. 9.3 - Plot and label the ordered pairs on the...Ch. 9.3 - Prob. 11ECh. 9.3 - Plot and label the ordered pairs on the...Ch. 9.3 - Prob. 13ECh. 9.3 - Plot and label the ordered pairs on the...Ch. 9.3 - Prob. 15ECh. 9.3 - Plot and label the ordered pairs on the...Ch. 9.3 - Plot and label the ordered pairs on the...Ch. 9.3 - Prob. 18ECh. 9.3 - Plot and label the ordered pairs on the...Ch. 9.3 - Plot and label the ordered pairs on the...Ch. 9.3 - Prob. 21ECh. 9.3 - Plot and label the ordered pairs on the...Ch. 9.3 - Give the coordinates of each point. KCh. 9.3 - Prob. 24ECh. 9.3 - Give the coordinates of each point. MCh. 9.3 - Prob. 26ECh. 9.3 - Give the coordinates of each point. OCh. 9.3 - Give the coordinates of each point. PCh. 9.3 - Give the coordinates of each point. QCh. 9.3 - Prob. 30ECh. 9.3 - Give the coordinates of each point. SCh. 9.3 - Prob. 32ECh. 9.3 - Prob. 33ECh. 9.3 - Give the coordinates of each point. VCh. 9.3 - Prob. 35ECh. 9.3 - Prob. 36ECh. 9.3 - Prob. 37ECh. 9.3 - Prob. 38ECh. 9.3 - Plot the points corresponding to each set of...Ch. 9.3 - Plot the points corresponding to each set of...Ch. 9.3 - Plot the points corresponding to each set of...Ch. 9.3 - Plot the points corresponding to each set of...Ch. 9.3 - Plot the points corresponding to each set of...Ch. 9.3 - Prob. 44ECh. 9.3 - Prob. 45ECh. 9.3 - Prob. 46ECh. 9.3 - Prob. 47ECh. 9.3 - Prob. 48ECh. 9.3 - Prob. 49ECh. 9.3 - Prob. 50ECh. 9.3 - Plot and label the ordered pairs on a rectangular...Ch. 9.3 - Prob. 2QQCh. 9.3 - Plot the points corresponding to each set of...Ch. 9.3 - Concept Check Line M passes through the points...Ch. 9.4 - Prob. 1ECh. 9.4 - Is (1,3) a solution to 2x+y=5? Why or why not?Ch. 9.4 - List four ordered pairs that are solutions to the...Ch. 9.4 - List four ordered pairs that are solutions to the...Ch. 9.4 - List four ordered pairs that are solutions to the...Ch. 9.4 - List four ordered pairs that are solutions to the...Ch. 9.4 - Prob. 7ECh. 9.4 - Prob. 8ECh. 9.4 - Prob. 9ECh. 9.4 - Prob. 10ECh. 9.4 - Use a chart to organize your work for exercises...Ch. 9.4 - Use a chart to organize your work for exercises...Ch. 9.4 - Use a chart to organize your work for exercises...Ch. 9.4 - Prob. 14ECh. 9.4 - Use a chart to organize your work for exercises...Ch. 9.4 - Use a chart to organize your work for exercises...Ch. 9.4 - Use a chart to organize your work for exercises...Ch. 9.4 - Use a chart to organize your work for exercises...Ch. 9.4 - Use a chart to organize your work for exercises...Ch. 9.4 - Use a chart to organize your work for exercises...Ch. 9.4 - Use a chart to organize your work for exercises...Ch. 9.4 - Use a chart to organize your work for exercises...Ch. 9.4 - Prob. 23ECh. 9.4 - Plot three ordered-pair solutions of the given...Ch. 9.4 - Plot three ordered-pair solutions of the given...Ch. 9.4 - Plot three ordered-pair solutions of the given...Ch. 9.4 - Prob. 27ECh. 9.4 - Prob. 28ECh. 9.4 - Plot three ordered-pair solutions of the given...Ch. 9.4 - Prob. 30ECh. 9.4 - Plot three ordered-pair solutions of the given...Ch. 9.4 - Prob. 32ECh. 9.4 - Plot three ordered-pair solutions of the given...Ch. 9.4 - Prob. 34ECh. 9.4 - Prob. 35ECh. 9.4 - Plot three ordered-pair solutions of the given...Ch. 9.4 - Prob. 37ECh. 9.4 - Prob. 38ECh. 9.4 - Prob. 40ECh. 9.4 - Prob. 41ECh. 9.4 - Prob. 42ECh. 9.4 - Prob. 43ECh. 9.4 - Prob. 44ECh. 9.4 - Prob. 1QQCh. 9.4 - Prob. 2QQCh. 9.4 - Prob. 3QQCh. 9.4 - Prob. 4QQCh. 9 - Course Enrollment Use this pictograph to answer...Ch. 9 - Course Enrollment Use this pictograph to answer...Ch. 9 - Prob. 3RPCh. 9 - Course Enrollment Use this pictograph to answer...Ch. 9 - Prob. 5RPCh. 9 - Prob. 6RPCh. 9 - Household Budget Nancy and Wally Worzowski's...Ch. 9 - Prob. 8RPCh. 9 - Prob. 9RPCh. 9 - Household Budget Nancy and Wally Worzowski's...Ch. 9 - Prob. 11RPCh. 9 - Household Budget Nancy and Wally Worzowski's...Ch. 9 - Population Growth The double-bar graph illustrates...Ch. 9 - Population Growth The double-bar graph illustrates...Ch. 9 - Population Growth The double-bar graph illustrates...Ch. 9 - Prob. 16RPCh. 9 - Population Growth The double-bar graph illustrates...Ch. 9 - Population Growth The double-bar graph illustrates...Ch. 9 - Population Growth The double-bar graph illustrates...Ch. 9 - Prob. 20RPCh. 9 - Trade-in Values vs Private Sale The comparison...Ch. 9 - Trade-in Values vs Private Sale The comparison...Ch. 9 - Trade-in Values vs Private Sale The comparison...Ch. 9 - Trade-in Values vs Private Sale The comparison...Ch. 9 - Trade-in Values vs Private Sale The comparison...Ch. 9 - Trade-in Values vs Private Sale The comparison...Ch. 9 - Trade-in Values vs Private Sale The comparison...Ch. 9 - Trade-in Values vs Private Sale The comparison...Ch. 9 - Circus Souvenir Use the information in the table...Ch. 9 - Prob. 30RPCh. 9 - Prob. 31RPCh. 9 - Bus Rides Use the information in the table to...Ch. 9 - Prob. 33RPCh. 9 - Find the median value. Student Enrollment The...Ch. 9 - Prob. 35RPCh. 9 - Find the median value. Pizza Delivery The numbers...Ch. 9 - Find the mean (average). Temperature Readings The...Ch. 9 - Find the mean (average). Groceries Purchased The...Ch. 9 - Find the mean (average). Textbooks Purchased The...Ch. 9 - Prob. 40RPCh. 9 - Find the mode. 22, 13, 18, 14, 13, 19Ch. 9 - Find the mode. 18, 14, 28, 18, 29, 18, 14Ch. 9 - Prob. 43RPCh. 9 - Prob. 44RPCh. 9 - Plot and label each point on the rectangular...Ch. 9 - Plot and label each point on the rectangular...Ch. 9 - Plot and label each point on the rectangular...Ch. 9 - Plot and label each point on the rectangular...Ch. 9 - Give the coordinates of each point. RCh. 9 - Give the coordinates of each point. SCh. 9 - Give the coordinates of each point. TCh. 9 - Give the coordinates of each point. UCh. 9 - Plot the points corresponding to the ordered pairs...Ch. 9 - Prob. 54RPCh. 9 - Prob. 55RPCh. 9 - List three ordered pairs that are solutions to the...Ch. 9 - Typing Speed The secretary for the JM law offices...Ch. 9 - Prob. 58RPCh. 9 - Fill in the ordered pairs so that they are...Ch. 9 - Graph each equation. y=3x1Ch. 9 - Graph each equation. y=5x4Ch. 9 - Graph each equation. y=4x6Ch. 9 - Graph each equation. y=1Ch. 9 - The ages of 5000 students on campus were recorded....Ch. 9 - The ages of 5000 students on campus were recorded....Ch. 9 - The ages of 5000 students on campus were recorded....Ch. 9 - Prob. 4TCh. 9 - The water in Toronto Harbor in Canada freezes...Ch. 9 - The water in Toronto Harbor in Canada freezes...Ch. 9 - Prob. 7TCh. 9 - Prob. 8TCh. 9 - The multiple bar graph indicates the number of...Ch. 9 - Prob. 10TCh. 9 - The multiple bar graph indicates the number of...Ch. 9 - The multiple bar graph indicates the number of...Ch. 9 - The multiple bar graph indicates the number of...Ch. 9 - Prob. 14TCh. 9 - A student received quiz grades of 89, 46, 85, 91,...Ch. 9 - Prob. 16TCh. 9 - Plot and label each ordered pair on the...Ch. 9 - Plot and label each ordered pair on the...Ch. 9 - Plot and label each ordered pair on the...Ch. 9 - Plot and label each ordered pair on the...Ch. 9 - Give the coordinates of each point. ACh. 9 - Give the coordinates of each point. BCh. 9 - Give the coordinates of each point. CCh. 9 - Prob. 24TCh. 9 - Plot the set of ordered pairs and then draw a line...Ch. 9 - Prob. 26TCh. 9 - Graph. y=4x2Ch. 9 - Graph. y=3x+1
Knowledge Booster

Similar questions
- I need help explaining on this example on how can I define the Time-Domain Function, Apply the Laplace Transformation Formula, andarrow_forwardma Classes Term. Spring 2025 Title Details Credit Hours CRN Schedule Type Grade Mode Level Date Status Message *MATHEMATICS FOR MANAGEME... MTH 245, 400 4 54835 Online Normal Grading Mode Ecampus Undergradu... 03/21/2025 Registered **Web Registered... *SOIL SCIENCE CSS 205, 400 0 52298 Online Normal Grading Mode Undergraduate 03/21/2025 Waitlisted Waitlist03/21/2025 PLANT PATHOLOGY BOT 451, 400 4 56960 Online Normal Grading Mode Undergraduate 03/21/2025 Registered **Web Registered... Records: 3 Schedule Schedule Detailsarrow_forwardHere is an augmented matrix for a system of equations (three equations and three variables). Let the variables used be x, y, and z: 1 2 4 6 0 1 -1 3 0 0 1 4 Note: that this matrix is already in row echelon form. Your goal is to use this row echelon form to revert back to the equations that this represents, and then to ultimately solve the system of equations by finding x, y and z. Input your answer as a coordinate point: (x,y,z) with no spaces.arrow_forward
- 1 3 -4 In the following matrix perform the operation 2R1 + R2 → R2. -2 -1 6 After you have completed this, what numeric value is in the a22 position?arrow_forward5 -2 0 1 6 12 Let A = 6 7 -1 and B = 1/2 3 -14 -2 0 4 4 4 0 Compute -3A+2B and call the resulting matrix R. If rij represent the individual entries in the matrix R, what numeric value is in 131? Input your answer as a numeric value only.arrow_forward1 -2 4 10 My goal is to put the matrix 5 -1 1 0 into row echelon form using Gaussian elimination. 3 -2 6 9 My next step is to manipulate this matrix using elementary row operations to get a 0 in the a21 position. Which of the following operations would be the appropriate elementary row operation to use to get a 0 in the a21 position? O (1/5)*R2 --> R2 ○ 2R1 + R2 --> R2 ○ 5R1+ R2 --> R2 O-5R1 + R2 --> R2arrow_forward
- The 2x2 linear system of equations -2x+4y = 8 and 4x-3y = 9 was put into the following -2 4 8 augmented matrix: 4 -3 9 This augmented matrix is then converted to row echelon form. Which of the following matrices is the appropriate row echelon form for the given augmented matrix? 0 Option 1: 1 11 -2 Option 2: 4 -3 9 Option 3: 10 ܂ -2 -4 5 25 1 -2 -4 Option 4: 0 1 5 1 -2 Option 5: 0 0 20 -4 5 ○ Option 1 is the appropriate row echelon form. ○ Option 2 is the appropriate row echelon form. ○ Option 3 is the appropriate row echelon form. ○ Option 4 is the appropriate row echelon form. ○ Option 5 is the appropriate row echelon form.arrow_forwardLet matrix A have order (dimension) 2x4 and let matrix B have order (dimension) 4x4. What results when you compute A+B? The resulting matrix will have dimensions of 2x4. ○ The resulting matrix will be a single number (scalar). The resulting matrix will have dimensions of 4x4. A+B is undefined since matrix A and B do not have the same dimensions.arrow_forwardIf -1 "[a446]-[254] 4b = -1 , find the values of a and b. ○ There is no solution for a and b. ○ There are infinite solutions for a and b. O a=3, b=3 O a=1, b=2 O a=2, b=1 O a=2, b=2arrow_forward
- A student puts a 3x3 system of linear equations is into an augmented matrix. The student then correctly puts the augmented matrix into row echelon form (REF), which yields the following resultant matrix: -2 3 -0.5 10 0 0 0 -2 0 1 -4 Which of the following conclusions is mathematically supported by the work shown about system of linear equations? The 3x3 system of linear equations has no solution. ○ The 3x3 system of linear equations has infinite solutions. The 3x3 system of linear equations has one unique solution.arrow_forwardSolve the following system of equations using matrices: -2x + 4y = 8 and 4x - 3y = 9 Note: This is the same system of equations referenced in Question 14. If a single solution exists, express your solution as an (x,y) coordinate point with no spaces. If there are infinite solutions write inf and if there are no solutions write ns in the box.arrow_forwardHi, I need to make sure I have drafted a thorough analysis, so please answer the following questions. Based on the data in the attached image, develop a regression model to forecast the average sales of football magazines for each of the seven home games in the upcoming season (Year 10). That is, you should construct a single regression model and use it to estimate the average demand for the seven home games in Year 10. In addition to the variables provided, you may create new variables based on these variables or based on observations of your analysis. Be sure to provide a thorough analysis of your final model (residual diagnostics) and provide assessments of its accuracy. What insights are available based on your regression model?arrow_forward
arrow_back_ios
SEE MORE QUESTIONS
arrow_forward_ios
Recommended textbooks for you
 Big Ideas Math A Bridge To Success Algebra 1: Stu...AlgebraISBN:9781680331141Author:HOUGHTON MIFFLIN HARCOURTPublisher:Houghton Mifflin Harcourt
 Glencoe Algebra 1, Student Edition, 9780079039897...AlgebraISBN:9780079039897Author:CarterPublisher:McGraw Hill
 Holt Mcdougal Larson Pre-algebra: Student Edition...AlgebraISBN:9780547587776Author:HOLT MCDOUGALPublisher:HOLT MCDOUGAL
 College Algebra (MindTap Course List)AlgebraISBN:9781305652231Author:R. David Gustafson, Jeff HughesPublisher:Cengage Learning
Big Ideas Math A Bridge To Success Algebra 1: Stu...
Algebra
ISBN:9781680331141
Author:HOUGHTON MIFFLIN HARCOURT
Publisher:Houghton Mifflin Harcourt
Glencoe Algebra 1, Student Edition, 9780079039897...
Algebra
ISBN:9780079039897
Author:Carter
Publisher:McGraw Hill
Holt Mcdougal Larson Pre-algebra: Student Edition...
Algebra
ISBN:9780547587776
Author:HOLT MCDOUGAL
Publisher:HOLT MCDOUGAL
College Algebra (MindTap Course List)
Algebra
ISBN:9781305652231
Author:R. David Gustafson, Jeff Hughes
Publisher:Cengage Learning