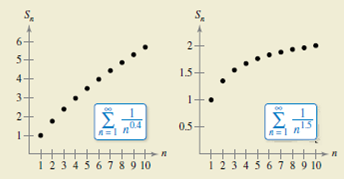
HOW DO YOU SEE IT? The graphs show the sequences of partial sums of the p- series ∑ n = 1 ∞ 1 n 0.4 and ∑ n = 1 ∞ 1 n 1.5 , Using Theorem 9.11, the first series diverges and the second series converges. Explain how the graphs show this.
HOW DO YOU SEE IT? The graphs show the sequences of partial sums of the p- series ∑ n = 1 ∞ 1 n 0.4 and ∑ n = 1 ∞ 1 n 1.5 , Using Theorem 9.11, the first series diverges and the second series converges. Explain how the graphs show this.
Solution Summary: The author analyzes the graphs that show partial sums of the p -series displaystyle
Evaluate the following integral over the Region R.
(Answer accurate to 2 decimal places).
√ √(x + y) A
R
R = {(x, y) | 25 < x² + y² ≤ 36, x < 0}
Hint: The integral and Region is defined in rectangular coordinates.
Find the volume of the solid that lies under the paraboloid z = 81 - x² - y² and within the cylinder
(x − 1)² + y² = 1. A plot of an example of a similar solid is shown below. (Answer accurate to 2
decimal places).
Volume using Double Integral
Paraboloid & Cylinder
-3
Hint: The integral and region is defined in polar coordinates.
Evaluate the following integral over the Region R.
(Answer accurate to 2 decimal places).
√4(1–2²
4(1 - x² - y²) dA
R
3
R = {(r,0) | 0 ≤ r≤ 2,0π ≤0≤¼˜}.
Hint: The integral is defined in rectangular coordinates. The Region is defined in polar coordinates.
Need a deep-dive on the concept behind this application? Look no further. Learn more about this topic, calculus and related others by exploring similar questions and additional content below.


 Algebra & Trigonometry with Analytic GeometryAlgebraISBN:9781133382119Author:SwokowskiPublisher:Cengage
 College AlgebraAlgebraISBN:9781305115545Author:James Stewart, Lothar Redlin, Saleem WatsonPublisher:Cengage Learning

 College Algebra (MindTap Course List)AlgebraISBN:9781305652231Author:R. David Gustafson, Jeff HughesPublisher:Cengage Learning