
a.
To identify: The claim and state
a.
Answer to Problem 4E
The claim is that “the
The hypotheses are given below:
Null hypothesis:
Alternative hypothesis:
Explanation of Solution
Given info:
Justification:
Here, the mean age of those playing the slot machines is less than those playing roulette is tested. Hence, the claim is that the mean age of those playing the slot machines is less than those playing roulette. This can be written as
The hypotheses are given below:
Null hypothesis:
Alternative hypothesis:
b.
To find: The critical value
b.
Answer to Problem 4E
The critical value at
Explanation of Solution
Calculation:
Here, the test is left tailed test.
Critical value:
Here, variances are not equal. Hence, the degrees of freedom is,
Software Procedure:
Step-by-step procedure to obtain the critical value using the MINITAB software:
- Choose Graph >
Probability Distribution Plot choose View Probability> OK. - From Distribution, choose ‘t’ distribution.
- In Degrees of freedom, enter 24.
- Click the Shaded Area tab.
- Choose Probability value and Left Tail for the region of the curve to shade.
- Enter the Probability value as 0.05.
- Click OK.
Output using the MINITAB software is given below:
From the output, the critical value is
c.
To find: The test value.
c.
Answer to Problem 4E
The test value is –4.51.
Explanation of Solution
Calculation:
Test statistic:
Software Procedure:
Step by step procedure to obtain test statistic using the MINITAB software:
- Choose Stat > Basic Statistics > 2-Sample t.
- Choose Summarized data.
- In first, enter
Sample size as25, Mean as 48.7, Standard deviation as 6.8. - In second, enter Sample size as35, Mean as 55.3, Standard deviation as 3.2.
- Choose Options.
- In Confidence level, enter 95.
- In Alternative, select less than.
- Click OK in all the dialogue boxes.
Output using the MINITAB software is given below:
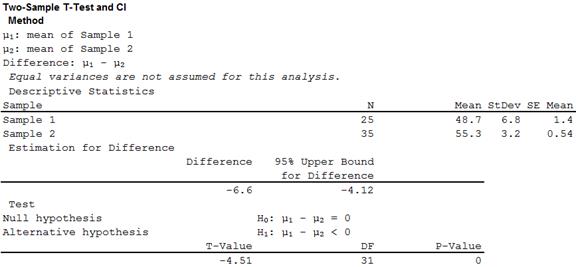
From the MINITAB output, the test value is –4.51.
d.
To make: The decision.
d.
Answer to Problem 4E
The decision is that, the null hypothesis is rejected.
Explanation of Solution
Calculation:
Software Procedure:
Step-by-step procedure to indicate the appropriate area and critical value using the MINITAB software:
- Choose Graph > Probability Distribution Plot choose View Probability> OK.
- From Distribution, choose ‘t’ distribution.
- In Degrees of freedom, enter 24.
- Click the Shaded Area tab.
- Choose Probability value and Left Tail for the region of the curve to shade.
- Enter the Probability value as 0.05.
- Enter –4.51 under show reference lines at X values
- Click OK.
Output using the MINITAB software is given below:
From the output, it can be observed that the test statistic value falls in the critical region. Therefore, the null hypothesis is rejected.
e.
To summarize: The result.
e.
Answer to Problem 4E
The conclusion is that, there is enough evidence to support the claim that the mean age of those playing the slot machines is less than those playing roulette.
Explanation of Solution
Justification:
From part (d), the null hypothesis is rejected. Thus, there is enough evidence to support the claim that the mean age of those playing the slot machines is less than those playing roulette.
Want to see more full solutions like this?
Chapter 9 Solutions
Elementary Statistics: A Step-by-Step Approach with Formula Card

- Given your fitted regression line, what would be the residual for snake #5 (10 C)?arrow_forwardCalculate the 95% confidence interval around your estimate of r using Fisher’s z-transformation. In your final answer, make sure to back-transform to the original units.arrow_forwardCalculate Pearson’s correlation coefficient (r) between temperature and heart rate.arrow_forward
- A researcher wishes to estimate, with 90% confidence, the population proportion of adults who support labeling legislation for genetically modified organisms (GMOs). Her estimate must be accurate within 4% of the true proportion. (a) No preliminary estimate is available. Find the minimum sample size needed. (b) Find the minimum sample size needed, using a prior study that found that 65% of the respondents said they support labeling legislation for GMOs. (c) Compare the results from parts (a) and (b). ... (a) What is the minimum sample size needed assuming that no prior information is available? n = (Round up to the nearest whole number as needed.)arrow_forwardThe table available below shows the costs per mile (in cents) for a sample of automobiles. At a = 0.05, can you conclude that at least one mean cost per mile is different from the others? Click on the icon to view the data table. Let Hss, HMS, HLS, Hsuv and Hмy represent the mean costs per mile for small sedans, medium sedans, large sedans, SUV 4WDs, and minivans respectively. What are the hypotheses for this test? OA. Ho: Not all the means are equal. Ha Hss HMS HLS HSUV HMV B. Ho Hss HMS HLS HSUV = μMV Ha: Hss *HMS *HLS*HSUV * HMV C. Ho Hss HMS HLS HSUV =μMV = = H: Not all the means are equal. D. Ho Hss HMS HLS HSUV HMV Ha Hss HMS HLS =HSUV = HMVarrow_forwardQuestion: A company launches two different marketing campaigns to promote the same product in two different regions. After one month, the company collects the sales data (in units sold) from both regions to compare the effectiveness of the campaigns. The company wants to determine whether there is a significant difference in the mean sales between the two regions. Perform a two sample T-test You can provide your answer by inserting a text box and the answer must include: Null hypothesis, Alternative hypothesis, Show answer (output table/summary table), and Conclusion based on the P value. (2 points = 0.5 x 4 Answers) Each of these is worth 0.5 points. However, showing the calculation is must. If calculation is missing, the whole answer won't get any credit.arrow_forward
 Glencoe Algebra 1, Student Edition, 9780079039897...AlgebraISBN:9780079039897Author:CarterPublisher:McGraw Hill
 College Algebra (MindTap Course List)AlgebraISBN:9781305652231Author:R. David Gustafson, Jeff HughesPublisher:Cengage Learning