
The five principles of relative dating and provide an example for each principle with the help of a sketch.
Answer to Problem 1BYL
Explanation of Solution
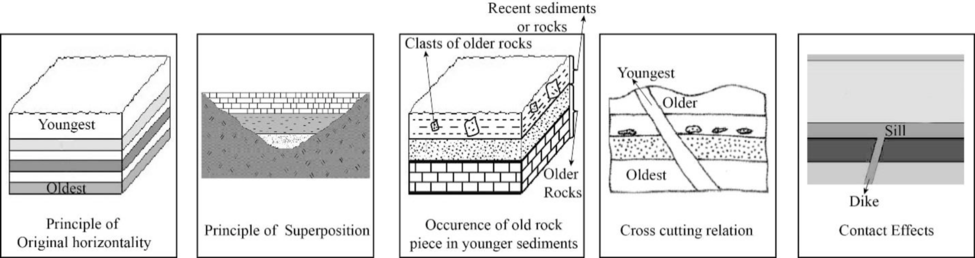
The geologic history of an area can be determined by ascertaining the age of geologic units, features, and events. The first step that can be used to determine the age of a rock relative to one another is the method of relative dating. Geoscientists assign the actual numbers in thousands to billions of years using analytical laboratory methods or isotopic dating to this relative chronology. To compare the ages of different rock layers and to correlate one rock unit relative to one another, fossils are also used. The five main principles of relative dating include the original horizontality, principle of superposition, cross-cutting relation, the occurrence of an older rock piece in younger sediment or rock, and contact effects.
The deposition of most sediments and volcanic units had occurred in more or less a horizontal pattern. The principle used to denote this process is known as principle of original horizontality. When the layers are no longer horizontal, it indicates the occurrence of some events after the formation of that layers. The special environments, such as the face of a sand dune or the undersea slopes of a delta are the few exceptions to the principle.
The principle of superposition states that when the deposition of a sediment layer occurs, it overlies the older rocks or sediments. In a sequence of horizontal sedimentary layer sequence, the oldest layer is on the bottom and the youngest layer is at the top.
The third principle of relative dating describes that a younger sediment or rock can contain pieces of an older rock. It indicates that during the formation of a rock or sedimentary deposit, pieces or clasts of older rocks are incorporated into it.
Principle of cross cutting relation states that the rocks are crosscut by fracture. Therefore, the rocks existed there before the formation of fractures. Mainly, there are two types of fractures. They are joints and faults. The slight pulling apart movement of the rock results in the formation of joints and faults are formed along which rocks on opposite side have moved up and down, side to side or as combination.
When magma erupts on to the surface or solidifies at depth, it comes into contact with the pre-existing rock. In both, this setting involves the baking of magma with adjacent rock or chemical alteration of nearby rocks due to the effects of fluids from the magma. Those type of changes that occurred following the eruption or solidification of magma are termed as contact effects.
Want to see more full solutions like this?
Chapter 9 Solutions
PRINT UPGRADE-EXPLORING GEOLOGY

- 5. Use Figure 9.14 to draw a topographic profile along the X-Y line from Sugar Loaf Mountain to Bear Lake and mark the position of the Lake Fork stream. (Use only index contours.) 6. Describe the shape of Lake Fork Valley, based on your profile. 7. What glacial feature is Lake Fork Valley?arrow_forward7. The streamlined, asymmetrical hills composed of till, labeled B, are what type of feature? 8. Examine the shape of the features labeled B on the map in Figure 9.10. How can these features be used to determine the direction of ice flow in a glaciated area? 9. Using the features labeled B in Figure 9.10 as a guide, draw an arrow on the map to indicate the direction of ice movement that occurred in this region. 10. What is the likely location of the outwash plain on the map? Identify and label the area "outwash plain." (Hint: Refer to Figure 9.7.) 11. Label the area covered by ground moraine. 12. What term is applied to the numerous almost circular depressions designated with the letter C?arrow_forwardRabbit population over time which letter(A,B,or C) shows a growth period for the rabbit populationarrow_forward
- Activity 9.5 Depositional Features Associated with Ice Sheets Pgs 159-1611. After examining the map and stereogram, draw a line on the map to outline the area illustrated on the stereogram. 2. What evidence on the map indicates that portions of the area are poorly drained? On what part of the map are these features located? 3. Use Figure 9.11 to draw a topographic profile of the X-Y line on Figure 9.10. 4. Is the general topography of the land in Sections 7 and 8 in the northwest portion of the region higher or lower in elevation than the land around the letter A located near the center of the map? Is it more or less hilly? 5. Is the area that coincides with Kettle Moraine State Forest higher or lower in elevation than the land to the northwest and southeast? 6. The feature labeled A on the map is a long ridge composed of till. Is this ridge an esker, an end moraine, or a drumlin? 7. The streamlined, asymmetrical hills composed of till, labeled B, are what type of feature?The features…arrow_forwardA prairie has plenty of grass.The soil on the prairie provides all of the following except? A.nutrients that help the grass live and grow B.a place for the roots of the grass to take holdC. Water in pore spaces that the grass can absorb D. Energy that the grass needs to make its foodarrow_forwardtimeters (inches) (11) 25.0 (10) 22.5 (9) 20.0 (8) 17.5 (7) 15.0 (6) 12.5 (5) 10.0 (4) 7.5 (70) 16 (60) 10 (50) 4 (40) 0(32) (30) -18 (3) 5.0 (2) 2.5 (1) 0 25.0 (10) (70) 16 (60) 10 Temperature °C (°F) Temperature °C (°F) — 22.5 (9) (50) 20.0 (8) 17.5 17 15.0 4 (40) 0(32) -1 (30) -7 (6) (20) 12.5 -12 (5) (10) 10.0 -18 (0) (4) (0) -23 7.5 (-10) (3) -23 (-10) -29 5.0 -29 (-20) (2) (-20) -34 2.5 -34 (-30) (-30) -40 0 -40 (-40) J F M A M J JASOND (-40) Month Station: San Francisco, California Lat/long: 37°37' N 122°23' W Avg. Ann. Temp. Total Ann. Precip.: 14°C (57.2°F) 47.5 cm (18.7 in.) Elevation: 5 m (16.4 ft) Population: 777,000 Ann. Temp. Range: 9°C (16.2 F°) Ann. Hr of Sunshine: (a) J F M A M J JASOND Month 2975 Station: Sevilla, Spain Lat/long: 37°22' N 6°00' W Avg. Ann. Temp.: 18°C (64.4°F) Total Ann. Precip.: 55.9 cm (22 in.) (b) Elevation: 13 m (42.6 ft) Population: 683,000 Ann. Temp. Range: 16 C° (28.8 F°) Ann. Hr of Sunshine: 2862 With all graphs, we start with the question,…arrow_forward
- I need help with part A, B and Carrow_forwardDiscussion Question: Atmospheric Water & Weather A+ This chapter beautifully focuses on water from the small molecular scale to large-scale weather patterns. The surplus of heat at the equator and the deficit at the Poles drives our atmospheric instability. Instability is a good thing! Without the unstable conditions, there would not be any atmospheric motion. The overheating of the equator pumps atmospheric uplift. As the air rises into lower pressures, it expands and cools... adiabatic cooling! The air migrates north and south and becomes denser than the surrounding air and sinks. The sinking air enters higher pressures and creates the subtropical high pressures and adiabatic heating...whaaaa-la! We have Hadley Cells! Not to mention, the Rainforests and World's largest deserts too! We now can imagine the Hadley cells in three-dimensions. They more or less "sandwich" the equator during the spring and fall equinoxes. However, what happens in the summer and winter? mP Maritime polar…arrow_forwardUsing the map. Solve part e f garrow_forward
- Answer the below questions in detail using the attached pictures. Please ensure it is all 100% done by human, please do not use AI or chatgpt. using the provided hydraulic head data (attached spreadsheet), plot the values at their corresponding piezometer locations (attached piezometer map), contour the head data to create equipotential lines that allow you to demonstrate the groundwater flow direction, indicate the flow direction with arrows, provide comments/observations about the characteristics of the groundwater flow system, for example, are the equipotential lines equally spaced? If not, can you comment on why there are areas with close spacing and other areas with wide spacing? Are there any areas where the aquifer displays artesian conditions? If so, where?arrow_forwardPlease answer the question in detail. Please ensure it is 100% done by human, please do not use AI or chatgpt. Organize your spreadsheets carefully and make sure they are easy to follow. Make sure that your units are consistent, use SI units and make sure your graphs are clear and well labelled.arrow_forwardPlease answer each question in detail. Please ensure it is 100% done by human, please do not use AI or chatgpt.arrow_forward
 Applications and Investigations in Earth Science ...Earth ScienceISBN:9780134746241Author:Edward J. Tarbuck, Frederick K. Lutgens, Dennis G. TasaPublisher:PEARSON
 Exercises for Weather & Climate (9th Edition)Earth ScienceISBN:9780134041360Author:Greg CarbonePublisher:PEARSON
 Environmental ScienceEarth ScienceISBN:9781260153125Author:William P Cunningham Prof., Mary Ann Cunningham ProfessorPublisher:McGraw-Hill Education
 Earth Science (15th Edition)Earth ScienceISBN:9780134543536Author:Edward J. Tarbuck, Frederick K. Lutgens, Dennis G. TasaPublisher:PEARSON
 Environmental Science (MindTap Course List)Earth ScienceISBN:9781337569613Author:G. Tyler Miller, Scott SpoolmanPublisher:Cengage Learning
 Physical GeologyEarth ScienceISBN:9781259916823Author:Plummer, Charles C., CARLSON, Diane H., Hammersley, LisaPublisher:Mcgraw-hill Education,