
Videos
(Learning Objective 5: Explore an actual bankruptcy; calculate leverage ratio, ROA, debt ratio, and times-Interest-earned ratio) In 2002, Enron Corporation filed for Chapter 11 Q bankruptcy protection, shocking the business community: How could a company so large and successful go bankrupt? This case explores the causes and the effects of Enron's bankruptcy.
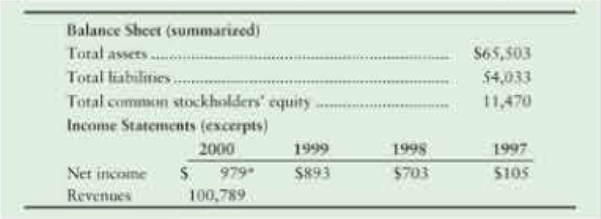
At December 31, 2000, and for the four years ended on that date. Enron reported the following (amounts in millions):
Unknown to Investors and lenders, Enron also controlled hundreds of
During the four-year period up to December 31, 2000, Enron’s stock price shot up from $17.50 to $90.56. Enron used its escalating stock price to finance the purchase of the SPEs by guaranteeing lenders that Enron would give them Enron stock if the SPEs could not pay their loans.
In 2001, the SEC launched an Investigation into Enron's accounting practices. It was alleged that Enron should have been including the SPEs In its financial statements all along. Enron then restated net income for the years up to 2000, wiping out nearly $600 million of total net income (and total assets) for this four-year period. Assume that $300 million of this loss applied to 2000. Enron's stock price tumbled, and the guarantees to the SPEs' lenders added millions to Enron's liabilities (assume the full amount of the SPEs' debt was included). To make matters worse, the assets of the SPEs lost much of their value; assume that their market value is only $500 million.
Requirements
1. Compute the debt ratio that Enron reported at the end of 2000. By using the DuPont Model, compute Enron's return on total assets (ROA) for 2000. For this purpose, use only total assets at the end of 2000, rather than the average of 1999 and 2000.
2. Compute Enron's leverage ratio for 2000. Use total assets and total
3. Add the asset and liability information about the SPEs to the reported amounts provided in the table. Recompute all ratios after including the SPEs in Enron's financial statements. Also compute Enron's times-interest-earned ratio both ways for 2000. Assume that the changes to Enron's financial position occurred during 2000.
4. Why does it appear that Enron failed to include the SPEs in its financial statements? How do you view Enron after including the SPEs in the company's financial statements? (Challenge)
Want to see the full answer?
Check out a sample textbook solution
Chapter 9 Solutions
Financial Accounting, Student Value Edition Plus MyLab Accounting with Pearson eText -- Access Card Package (12th Edition)


- I want Answerarrow_forwardHoney Manufacturing produces two products: X and Y. The annual production and sales of Product X is 1,950 units, and Product Y is 1,300 units. The company has traditionally used direct labor-hours as the basis for applying all manufacturing overhead to products. Product X requires 0.5 direct labor-hours per unit, and Product Y requires 0.8 direct labor-hours per unit. The predetermined overhead rate is $72.00 per direct labor-hour. What is the amount of overhead cost that will be allocated to each unit of Product Y? Provide answerarrow_forwardhello tutor help this answer with accountingarrow_forward
- Dawson Industries uses direct labor-hours in its predetermined overhead rate. At the beginning of the year, the total estimated manufacturing overhead was $412,500. At the end of the year, actual direct labor-hours for the year were 26,500 hours, manufacturing overhead for the year was overapplied by $9,700, and the actual manufacturing overhead was $406,300. Calculate the predetermined overhead rate for the year. Need helparrow_forwardWhat is the leverage fector for blue ridge Inc?? Accountingarrow_forwardGive me Answerarrow_forward

 Financial Reporting, Financial Statement Analysis...FinanceISBN:9781285190907Author:James M. Wahlen, Stephen P. Baginski, Mark BradshawPublisher:Cengage Learning
 EBK CONTEMPORARY FINANCIAL MANAGEMENTFinanceISBN:9781337514835Author:MOYERPublisher:CENGAGE LEARNING - CONSIGNMENT