
Explanation:
Figure 1 illustrates the impact of world price and domestic price that creates trade diversification and creation.
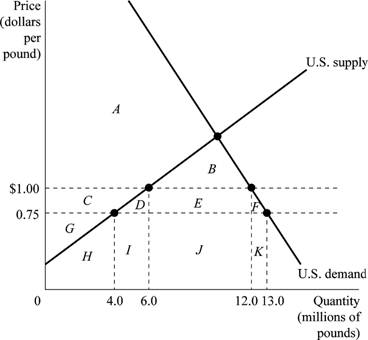
Figure 1
Figure 1 depicts the demand and supply of kumquats in the U.S. market after the quota restriction is imposed. Horizontal axis represents the quantity of kumquats in millions of pounds and the vertical axis represents the price in dollars per pound. The U.S. government imposes a quota of import of 6 million pounds of kumquats to the U.S. each year.
Using Figure 1, Table 1 is filled as follows:
Table 1
| Without Quota | With Quota | |
| World price of kumquats | $0.75 | $0.75 |
| U.S. price of kumquats | $0.75 | $1.00 |
| Quantity supplied by U.S. firms | 4 million | 6 million |
| Quantity demanded | 13 million | 12 million |
| Quantity imported | 9 million | 6 million |
| Area of consumer surplus | A + B + C + D + E + F | A + B |
| Area of domestic producer surplus | G | C + G |
| Area of deadweight loss | No deadweight loss | D + F |
When there is no quota, the quantity demanded is 13 million pounds of kumquats; out of which 4 million pounds is supplied by U.S. firms and rest 9 million pounds of kumquats
Consumer surplus is calculated as the area below the demand curve and above the market price. So, area of consumer surplus without quota is between market price of $0.75 and the demand curve, which is the sum of the areas A, B, C, D, E and F. The producer’s surplus is between U.S supply curve (above) and market price (below), which is the area G. With quota, consumer surplus is between price $1 and U.S demand curve, which is the sum of areas A and B, and the producer’s surplus which is increased by quota is the sum of areas C and G. There is no deadweight loss, if quotas are not imposed. With quota areas D and F denote the deadweight loss.
Concept introduction:
Quota: It is the numerical limit that a government imposes on the quantity of goods that can be imported into a country.
Consumer surplus: It is the monetary gain attained by a consumer, which is calculated as the difference between the price a consumer pays for the product and the price he would be willing to pay rather than do without it.
Producer surplus: It is the benefit attained by a producer by selling a product, which is calculated as the difference between the amount that a producer is willing to supply goods for and the actual amount received by him, when he makes the trade.
Measuring the economic effects of a quota.
Want to see the full answer?
Check out a sample textbook solution
Chapter 9 Solutions
Economics Plus MyLab Economics with Pearson eText (2-semester Access) -- Access Card Package (6th Edition) (The Pearson Series in Economics)

- Explain how much of emotional, mental and physical toll makes it so difficult to break the cycle of poverty.arrow_forwardCase Study: The Impact of Ebola on Tax Revenue in the DRC Background: The Democratic Republic of the Congo has experienced mulitiple outbreaks, with the 2018-2020 outbreak being one of the most severe. The outbreak had profound effects on public health, the economy and government operations. The DRC's economy already fragile due to policital instability and conflict, faced additional stain as the Ebola virus spread across several provinces. Economic disruption: The Ebola outbreak led to significant disruptions in the affected regions. Businesses were forced to close or reduce operations due to quarantine measures and the fear of contagion. this resulted in a sharp decline in economic activities, particularly in sectors such as agriculute, mining and trade. reduced consumer spending and interruptions in supply chains further exacerbated the economic downturn. Impact on Tax Revenue: the economic…arrow_forwardKey shortcomings of the Human Capital approach to measuring the monetary value of benefits of new treatments are that it Will generate lower benefits for male lives on average Will generate higher benefits for female lives on average Will tend to OVERVALUE improvements in quality of life Will tend to UNDERVALUE improved survival for people out of labour forcearrow_forward
- One of the key concepts in economics that underpins the necessity of making tough choices and confronting difficult tradeoffs through some form of collective decision-making is called Production Consumption Exchange Equity Scarcityarrow_forwardAllocative efficiency WITHIN the health care sector refers to What mix of nonmedical and medical goods and services should be produced in the macro-economy What mix of medical goods and services should be produced in the health economy What specific health care resources should be used to produce the chosen medical goods and services Who should receive the medical goods and services that are producedarrow_forwardProduction efficiency is most concerned with Choice of inputs in production process Quantity of outputs resulting from the production process The technological process of production All of the abovearrow_forward
- Choose all of the following that are assumed to be constant while constructing the production possibilities curve Technology Precise mix of inputs Institutional arrangements like judicial protection of business contracts Outputsarrow_forwardA point that lies OUTSIDE of the PPC can be achieved if A major technological innovation increases production efficiency A sudden influx of resources e.g., massive immigration of trained nurses Economic reform resulting in greater protection of intellectual property rights All of the above Only options 1 and 2arrow_forwardThe marginal benefit from each successive unit of medical care consumed declines BECAUSE each successive unit is more expensive to produce True Falsearrow_forward
 Principles of Economics, 7th Edition (MindTap Cou...EconomicsISBN:9781285165875Author:N. Gregory MankiwPublisher:Cengage Learning
 Principles of Macroeconomics (MindTap Course List)EconomicsISBN:9781285165912Author:N. Gregory MankiwPublisher:Cengage Learning
 Microeconomics: Private and Public Choice (MindTa...EconomicsISBN:9781305506893Author:James D. Gwartney, Richard L. Stroup, Russell S. Sobel, David A. MacphersonPublisher:Cengage Learning
 Macroeconomics: Private and Public Choice (MindTa...EconomicsISBN:9781305506756Author:James D. Gwartney, Richard L. Stroup, Russell S. Sobel, David A. MacphersonPublisher:Cengage Learning
 Economics: Private and Public Choice (MindTap Cou...EconomicsISBN:9781305506725Author:James D. Gwartney, Richard L. Stroup, Russell S. Sobel, David A. MacphersonPublisher:Cengage Learning