
Explanation:
Figure 1 illustrates the impact of world price and domestic price that creates trade diversification and creation.
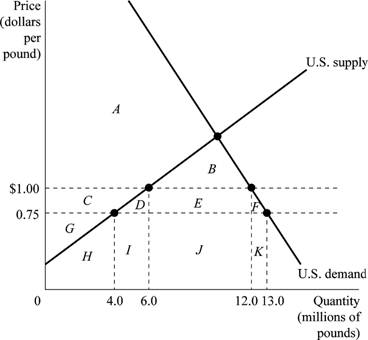
Figure 1
Figure 1 depicts the demand and supply of kumquats in the U.S. market after the quota restriction is imposed. Horizontal axis represents the quantity of kumquats in millions of pounds and the vertical axis represents the price in dollars per pound. The U.S. government imposes a quota of import of 6 million pounds of kumquats to the U.S. each year.
Using Figure 1, Table 1 is filled as follows:
Table 1
| Without Quota | With Quota | |
| World price of kumquats | $0.75 | $0.75 |
| U.S. price of kumquats | $0.75 | $1.00 |
| Quantity supplied by U.S. firms | 4 million | 6 million |
| Quantity demanded | 13 million | 12 million |
| Quantity imported | 9 million | 6 million |
| Area of consumer surplus | A + B + C + D + E + F | A + B |
| Area of domestic producer surplus | G | C + G |
| Area of deadweight loss | No deadweight loss | D + F |
When there is no quota, the quantity demanded is 13 million pounds of kumquats; out of which 4 million pounds is supplied by U.S. firms and rest 9 million pounds of kumquats
Consumer surplus is calculated as the area below the demand curve and above the market price. So, area of consumer surplus without quota is between market price of $0.75 and the demand curve, which is the sum of the areas A, B, C, D, E and F. The producer’s surplus is between U.S supply curve (above) and market price (below), which is the area G. With quota, consumer surplus is between price $1 and U.S demand curve, which is the sum of areas A and B, and the producer’s surplus which is increased by quota is the sum of areas C and G. There is no deadweight loss, if quotas are not imposed. With quota areas D and F denote the deadweight loss.
Concept introduction:
Quota: It is the numerical limit that a government imposes on the quantity of goods that can be imported into a country.
Consumer surplus: It is the monetary gain attained by a consumer, which is calculated as the difference between the price a consumer pays for the product and the price he would be willing to pay rather than do without it.
Producer surplus: It is the benefit attained by a producer by selling a product, which is calculated as the difference between the amount that a producer is willing to supply goods for and the actual amount received by him, when he makes the trade.
Measuring the economic effects of a quota.
Want to see the full answer?
Check out a sample textbook solution
Chapter 9 Solutions
Economics (7th Edition) (What's New in Economics)

- Answerarrow_forwardM” method Given the following model, solve by the method of “M”. (see image)arrow_forwardAs indicated in the attached image, U.S. earnings for high- and low-skill workers as measured by educational attainment began diverging in the 1980s. The remaining questions in this problem set use the model for the labor market developed in class to walk through potential explanations for this trend. 1. Assume that there are just two types of workers, low- and high-skill. As a result, there are two labor markets: supply and demand for low-skill workers and supply and demand for high-skill workers. Using two carefully drawn labor-market figures, show that an increase in the demand for high skill workers can explain an increase in the relative wage of high-skill workers. 2. Using the same assumptions as in the previous question, use two carefully drawn labor-market figures to show that an increase in the supply of low-skill workers can explain an increase in the relative wage of high-skill workers.arrow_forward
- Published in 1980, the book Free to Choose discusses how economists Milton Friedman and Rose Friedman proposed a one-sided view of the benefits of a voucher system. However, there are other economists who disagree about the potential effects of a voucher system.arrow_forwardThe following diagram illustrates the demand and marginal revenue curves facing a monopoly in an industry with no economies or diseconomies of scale. In the short and long run, MC = ATC. a. Calculate the values of profit, consumer surplus, and deadweight loss, and illustrate these on the graph. b. Repeat the calculations in part a, but now assume the monopoly is able to practice perfect price discrimination.arrow_forwardThe projects under the 'Build, Build, Build' program: how these projects improve connectivity and ease of doing business in the Philippines?arrow_forward
 Principles of Economics, 7th Edition (MindTap Cou...EconomicsISBN:9781285165875Author:N. Gregory MankiwPublisher:Cengage Learning
 Principles of Macroeconomics (MindTap Course List)EconomicsISBN:9781285165912Author:N. Gregory MankiwPublisher:Cengage Learning
 Microeconomics: Private and Public Choice (MindTa...EconomicsISBN:9781305506893Author:James D. Gwartney, Richard L. Stroup, Russell S. Sobel, David A. MacphersonPublisher:Cengage Learning
 Macroeconomics: Private and Public Choice (MindTa...EconomicsISBN:9781305506756Author:James D. Gwartney, Richard L. Stroup, Russell S. Sobel, David A. MacphersonPublisher:Cengage Learning
 Economics: Private and Public Choice (MindTap Cou...EconomicsISBN:9781305506725Author:James D. Gwartney, Richard L. Stroup, Russell S. Sobel, David A. MacphersonPublisher:Cengage Learning